
 Yahoo Finance
 Solution Financial Inc.'s (TSE:SFI) Popularity With Investors Is Under Threat From Overpricing
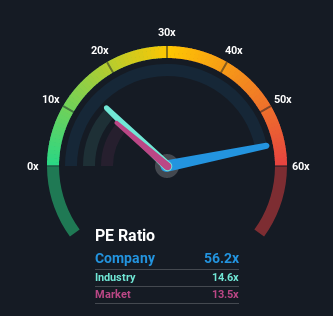
When close to half the companies in Canada have price-to-earnings ratios (or "P/E's") below 13x, you may consider Solution Financial Inc. (TSE:SFI) as a stock to avoid entirely with its 56.2x P/E ratio. Although, it's not wise to just take the P/E at face value as there may be an explanation why it's so lofty.
With earnings growth that's exceedingly strong of late, Solution Financial has been doing very well. The P/E is probably high because investors think this strong earnings growth will be enough to outperform the broader market in the near future. If not, then existing shareholders might be a little nervous about the viability of the share price.
See our latest analysis for Solution Financial
We don't have analyst forecasts, but you can see how recent trends are setting up the company for the future by checking out our free report on Solution Financial's earnings, revenue and cash flow.
How Is Solution Financial's Growth Trending?
In order to justify its P/E ratio, Solution Financial would need to produce outstanding growth well in excess of the market.
Retrospectively, the last year delivered an exceptional 70% gain to the company's bottom line. Although, its longer-term performance hasn't been as strong with three-year EPS growth being relatively non-existent overall. So it appears to us that the company has had a mixed result in terms of growing earnings over that time.
Comparing that to the market, which is predicted to deliver 11% growth in the next 12 months, the company's momentum is weaker based on recent medium-term annualised earnings results.
With this information, we find it concerning that Solution Financial is trading at a P/E higher than the market. Apparently many investors in the company are way more bullish than recent times would indicate and aren't willing to let go of their stock at any price. There's a good chance existing shareholders are setting themselves up for future disappointment if the P/E falls to levels more in line with recent growth rates.
The Bottom Line On Solution Financial's P/E
It's argued the price-to-earnings ratio is an inferior measure of value within certain industries, but it can be a powerful business sentiment indicator.
Our examination of Solution Financial revealed its three-year earnings trends aren't impacting its high P/E anywhere near as much as we would have predicted, given they look worse than current market expectations. When we see weak earnings with slower than market growth, we suspect the share price is at risk of declining, sending the high P/E lower. Unless the recent medium-term conditions improve markedly, it's very challenging to accept these prices as being reasonable.
Don't forget that there may be other risks. For instance, we've identified 3 warning signs for Solution Financial that you should be aware of.
If you're unsure about the strength of Solution Financial's business, why not explore our interactive list of stocks with solid business fundamentals for some other companies you may have missed.
This article by Simply Wall St is general in nature. We provide commentary based on historical data and analyst forecasts only using an unbiased methodology and our articles are not intended to be financial advice. It does not constitute a recommendation to buy or sell any stock, and does not take account of your objectives, or your financial situation. We aim to bring you long-term focused analysis driven by fundamental data. Note that our analysis may not factor in the latest price-sensitive company announcements or qualitative material. Simply Wall St has no position in any stocks mentioned.
Have feedback on this article? Concerned about the content? Get in touch with us directly. Alternatively, email editorial-team (at) simplywallst.com.
