
 Yahoo Finance
 How SORL Auto Parts Inc’s (NASDAQ:SORL) Earnings Growth Stacks Up Against The Industry

After looking at SORL Auto Parts Inc’s (NASDAQ:SORL) latest earnings update (31 March 2018), I found it helpful to revisit the company’s performance in the past couple of years and compare this against the latest numbers. As a long-term investor I tend to focus on earnings trend, rather than a single number at one point in time. Also, comparing it against an industry benchmark to understand whether it outperformed, or is simply riding an industry wave, is an important aspect. In this article I briefly touch on my key findings. See our latest analysis for SORL Auto Parts
How Did SORL’s Recent Performance Stack Up Against Its Past?
For the most up-to-date info, I use the ‘latest twelve-month’ data, which annualizes the latest 6-month earnings release, or some times, the latest annual report is already the most recent financial data. This blend enables me to assess different stocks in a uniform manner using the latest information. For SORL Auto Parts, its latest earnings (trailing twelve month) is US$25.67M, which, in comparison to the prior year’s level, has declined by -0.15%. Since these figures may be somewhat myopic, I have calculated an annualized five-year value for SORL’s net income, which stands at US$15.84M This shows that, on average, SORL Auto Parts has been able to grow its earnings over the last couple of years.
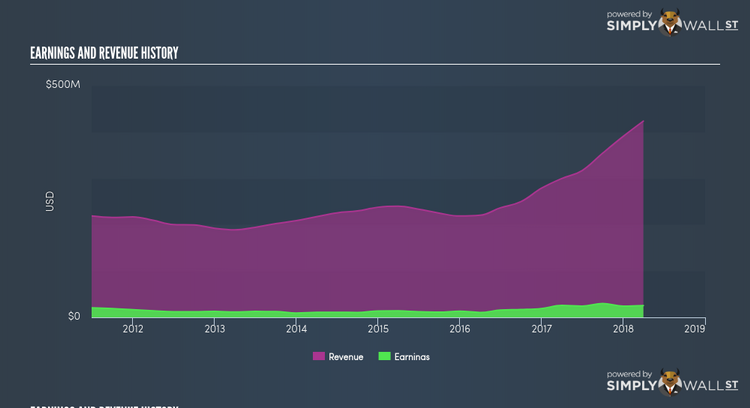
How has it been able to do this? Let’s take a look at if it is only attributable to an industry uplift, or if SORL Auto Parts has seen some company-specific growth. The ascend in earnings seems to be propelled by a strong top-line increase outstripping its growth rate of expenses. Though this has caused a margin contraction, it has made SORL Auto Parts more profitable. Looking at growth from a sector-level, the US auto components industry has been growing its average earnings by double-digit 11.81% in the prior year, and 11.36% over the last five years. This suggests that any tailwind the industry is enjoying, SORL Auto Parts has not been able to gain as much as its industry peers.
What does this mean?
SORL Auto Parts’s track record can be a valuable insight into its earnings performance, but it certainly doesn’t tell the whole story. Companies that are profitable, but have capricious earnings, can have many factors influencing its business. I suggest you continue to research SORL Auto Parts to get a more holistic view of the stock by looking at:
Future Outlook: What are well-informed industry analysts predicting for SORL’s future growth? Take a look at our free research report of analyst consensus for SORL’s outlook.
Financial Health: Is SORL’s operations financially sustainable? Balance sheets can be hard to analyze, which is why we’ve done it for you. Check out our financial health checks here.
Other High-Performing Stocks: Are there other stocks that provide better prospects with proven track records? Explore our free list of these great stocks here.
NB: Figures in this article are calculated using data from the trailing twelve months from 31 March 2018. This may not be consistent with full year annual report figures.
To help readers see pass the short term volatility of the financial market, we aim to bring you a long-term focused research analysis purely driven by fundamental data. Note that our analysis does not factor in the latest price sensitive company announcements.
The author is an independent contributor and at the time of publication had no position in the stocks mentioned.
