
 Yahoo Finance
 Southwest Airlines (LUV) Q4 Earnings & Revenues Beat, Up Y/Y

Southwest Airlines Co. (LUV) reported fourth-quarter 2023 earnings per share of 37 cents, which outpaced the Zacks Consensus Estimate of 11 cents. In the year-ago quarter, LUV incurred a loss of 38 cents per share.
Revenues of $6,822 million outpaced the Zacks Consensus Estimate of $6,741.5 million and improved 10.5% year over year. The uptick was owing to healthy leisure demand and continued yield strength, mainly during the holiday time, coupled with record fourth-quarter ancillary revenues, loyalty program revenues, and passengers carried. Close-in bookings, including managed business bookings, performed at the better end of expectations in November and December 2023, driving fourth-quarter unit revenues to outperform the company's previous guidance range.
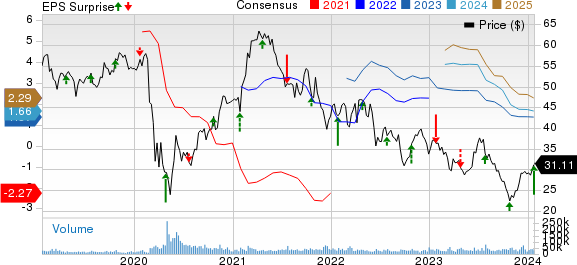
Southwest Airlines Co. Price, Consensus and EPS Surprise
Southwest Airlines Co. price-consensus-eps-surprise-chart | Southwest Airlines Co. Quote
Operating Statistics
Airline traffic, measured in revenue passenger miles, increased 13.7% year over year to 35.58 billion in the quarter under review. Capacity or available seat miles (ASMs) climbed 21.4% year over year to 45.51 billion. Load factor (percentage of seats filled by passengers) fell to 78.2% from 83.5% in the year-ago quarter.The actual figure for the load factor was lower than our expectation of 83.3%.
Passenger revenue per available seat mile (PRASM: a key measure of unit revenues) descended 7.6% year over year to 13.65 cents.The actual figure was lower than our estimate of 13.73 cents.
Revenue per available seat mile (RASM) fell 8.9% to 14.99 cents.The actual figure was higher than our estimate of 14.90 cents.
Operating Expenses & Income
In the fourth quarter, Southwest Airlines incurred an operating loss (as reported) of $361 million compared with a loss of $386 million in the year-ago quarter. On an adjusted basis (excluding special items), the company reported operating income of $177 million against the loss of $344 million in the year-ago quarter. Total adjusted operating expenses (excluding profit sharing, special items, fuel and oil expenses) decreased 0.7%.
Fuel cost per gallon (inclusive of fuel tax: economic) fell 5.7% to $3.00. The actual figure was higher than our estimate of $2.90.
Consolidated unit cost or cost per available seat mile (CASM) excluding fuel, oil and profit-sharing expenses, and special items fell 18.1% year over year.
Liquidity
Southwest Airlines ended the fourth quarter with cash and cash equivalents of $9,288 million compared with $9,497 million at the end of September 2023. As of Dec 31, 2023, the company had long-term debt (less current maturities) of $7,978 million compared with $7,984 million at the end of September 2023.
LUV generated $425 million of cash from operating activities in the reported quarter, while CapEx was $707 million.
Q1 & Full-Year Outlook
For the first quarter of 2024, ASMs are estimated to improve 10% from the year-ago reported figure. Economic fuel costs per gallonare expected to be between $2.70 and $2.80. RASM is anticipated to improve 2.5-4.5% from the year-ago reported figure. LUV expects CASM, excluding fuel, oil and profit-sharing expenses, and special items, to increase 6-7% in the first quarter from the comparable period in 2022. Interest expenses are expected to be $62 million in the first quarter.
For 2024, Southwest Airlines expects capacity to improve 6% from the 2023 level. Economic fuel costs per gallon are estimated to be between $2.55 and $2.65. CASM, excluding fuel, oil and profit-sharing expenses, and special items, is still anticipated to increase in the range of 6-7% in 2024 from 2023. Interest expenses are expected to be $249 million in 2024. The effective tax rate is still expected to be 23-24% in the year. Capital expenditures are anticipated to be in the range of $3.5-$4 billion for 2024.
Currently, Southwest Airlines carries a Zacks Rank #3 (Hold). You can see the complete list of today’s Zacks #1 Rank (Strong Buy) stocks here.
Performances of Other Transportation Companies
J.B. Hunt Transport Services, Inc.’s JBHT fourth-quarter 2023 earnings of $1.47 per share missed the Zacks Consensus Estimate of $1.74 and declined 23.4% year over year.
JBHT’s total operating revenues of $3,303.70 million surpassed the Zacks Consensus Estimate of $3,236.2 million but fell 9.5% year over year. Total operating revenues, excluding fuel surcharge revenue, fell 6% year over year.
Delta Air Lines DAL has reported fourth-quarter 2023 earnings (excluding $1.88 from non-recurring items) of $1.28 per share, which comfortably beat the Zacks Consensus Estimate of $1.17. Earnings, however, declined 13.51% on a year-over-year basis due to high labor costs.
Revenues of $14,223 million surpassed the Zacks Consensus Estimate of $14,069.5 million and increased 5.87% on a year-over-year basis, driven by strong holiday-air-travel demand. Adjusted operating revenues (excluding third-party refinery sales) came in at $13,661 million, up 11% year over year.
United Airlines Holdings, Inc. UAL reported fourth-quarter 2023 earnings per share (excluding 19 cents from non-recurring items) of $2.00, which outpaced the Zacks Consensus Estimate of $1.61 but declined 18.7% year over year.
Operating revenues of $13,626 million beat the Zacks Consensus Estimate of $13,546.8 million. The top line increased 9.9% year over year due to upbeat air-travel demand. This was driven by a 10.9% rise in passenger revenues (accounting for 91.1% of the top line) to $12,421 million. Almost 41,779 passengers traveled on UAL flights in the fourth quarter.
Want the latest recommendations from Zacks Investment Research? Today, you can download 7 Best Stocks for the Next 30 Days. Click to get this free report
Delta Air Lines, Inc. (DAL) : Free Stock Analysis Report
United Airlines Holdings Inc (UAL) : Free Stock Analysis Report
Southwest Airlines Co. (LUV) : Free Stock Analysis Report
J.B. Hunt Transport Services, Inc. (JBHT) : Free Stock Analysis Report
