
 Yahoo Finance
 Spark New Zealand (NZSE:SPK) Hasn't Managed To Accelerate Its Returns
If we want to find a stock that could multiply over the long term, what are the underlying trends we should look for? Firstly, we'd want to identify a growing return on capital employed (ROCE) and then alongside that, an ever-increasing base of capital employed. This shows us that it's a compounding machine, able to continually reinvest its earnings back into the business and generate higher returns. So when we looked at Spark New Zealand (NZSE:SPK), they do have a high ROCE, but we weren't exactly elated from how returns are trending.
What Is Return On Capital Employed (ROCE)?
Just to clarify if you're unsure, ROCE is a metric for evaluating how much pre-tax income (in percentage terms) a company earns on the capital invested in its business. To calculate this metric for Spark New Zealand, this is the formula:
Return on Capital Employed = Earnings Before Interest and Tax (EBIT) ÷ (Total Assets - Current Liabilities)
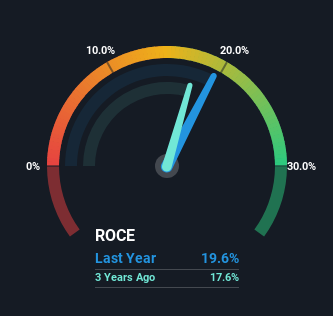
0.20 = NZ$705m ÷ (NZ$4.7b - NZ$1.1b) (Based on the trailing twelve months to December 2023).
Thus, Spark New Zealand has an ROCE of 20%. That's a fantastic return and not only that, it outpaces the average of 7.3% earned by companies in a similar industry.
View our latest analysis for Spark New Zealand
Above you can see how the current ROCE for Spark New Zealand compares to its prior returns on capital, but there's only so much you can tell from the past. If you'd like to see what analysts are forecasting going forward, you should check out our free analyst report for Spark New Zealand .
How Are Returns Trending?
There hasn't been much to report for Spark New Zealand's returns and its level of capital employed because both metrics have been steady for the past five years. It's not uncommon to see this when looking at a mature and stable business that isn't re-investing its earnings because it has likely passed that phase of the business cycle. So while the current operations are delivering respectable returns, unless capital employed increases we'd be hard-pressed to believe it's a multi-bagger going forward. On top of that you'll notice that Spark New Zealand has been paying out a large portion (109%) of earnings in the form of dividends to shareholders. These mature businesses typically have reliable earnings and not many places to reinvest them, so the next best option is to put the earnings into shareholders pockets.
Our Take On Spark New Zealand's ROCE
Although is allocating it's capital efficiently to generate impressive returns, it isn't compounding its base of capital, which is what we'd see from a multi-bagger. Since the stock has gained an impressive 42% over the last five years, investors must think there's better things to come. However, unless these underlying trends turn more positive, we wouldn't get our hopes up too high.
On a final note, we found 3 warning signs for Spark New Zealand (1 is significant) you should be aware of.
High returns are a key ingredient to strong performance, so check out our free list ofstocks earning high returns on equity with solid balance sheets.
Have feedback on this article? Concerned about the content? Get in touch with us directly. Alternatively, email editorial-team (at) simplywallst.com.
This article by Simply Wall St is general in nature. We provide commentary based on historical data and analyst forecasts only using an unbiased methodology and our articles are not intended to be financial advice. It does not constitute a recommendation to buy or sell any stock, and does not take account of your objectives, or your financial situation. We aim to bring you long-term focused analysis driven by fundamental data. Note that our analysis may not factor in the latest price-sensitive company announcements or qualitative material. Simply Wall St has no position in any stocks mentioned.
