
 Yahoo Finance
 Stalexport Autostrady SA. (WSE:STX): Does The Earnings Decline Make It An Underperformer?

When Stalexport Autostrady SA. (WSE:STX) released its most recent earnings update (31 March 2018), I wanted to understand how these figures stacked up against its past performance. The two benchmarks I used were Stalexport Autostrady’s average earnings over the past couple of years, and its industry performance. These are useful yardsticks to help me gauge whether or not STX actually performed well. Below is a quick commentary on how I see STX has performed. View our latest analysis for Stalexport Autostrady
Was STX’s weak performance lately a part of a long-term decline?
I look at data from the most recent 12 months, which either annualizes the most recent 6-month earnings update, or in some cases, the most recent annual report is already the latest available financial data. This blend allows me to analyze many different companies in a uniform manner using new information. For Stalexport Autostrady, its most recent trailing-twelve-month earnings is ZŁ149.39M, which, relative to last year’s figure, has declined by -4.95%. Since these values are somewhat nearsighted, I have created an annualized five-year value for Stalexport Autostrady’s earnings, which stands at ZŁ77.06M This suggests that while earnings declined from the prior year, over the long run, Stalexport Autostrady’s profits have been growing on average.
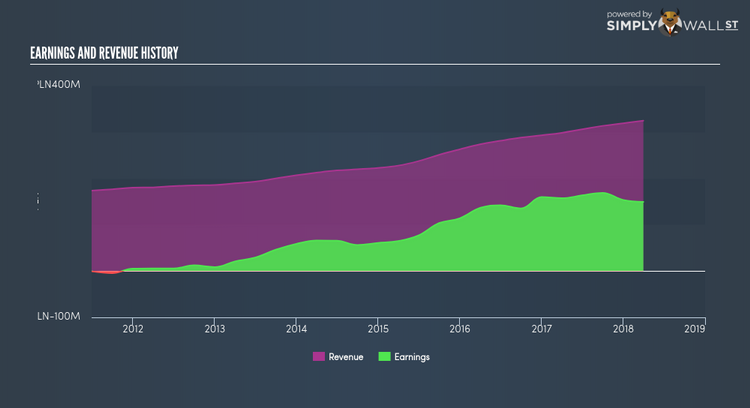
What’s enabled this growth? Well, let’s take a look at whether it is only because of an industry uplift, or if Stalexport Autostrady has seen some company-specific growth. In the last few years, Stalexport Autostrady increased its bottom line faster than revenue by effectively controlling its costs. This brought about a margin expansion and profitability over time. Inspecting growth from a sector-level, the PL infrastructure industry has been growing its average earnings by double-digit 10.25% over the past twelve months, and a less exciting 8.37% over the past half a decade. This means that any uplift the industry is enjoying, Stalexport Autostrady has not been able to realize the gains unlike its industry peers.
What does this mean?
While past data is useful, it doesn’t tell the whole story. Companies that are profitable, but have volatile earnings, can have many factors affecting its business. You should continue to research Stalexport Autostrady to get a more holistic view of the stock by looking at:
Financial Health: Is STX’s operations financially sustainable? Balance sheets can be hard to analyze, which is why we’ve done it for you. Check out our financial health checks here.
Valuation: What is STX worth today? Is the stock undervalued, even when its growth outlook is factored into its intrinsic value? The intrinsic value infographic in our free research report helps visualize whether STX is currently mispriced by the market.
Other High-Performing Stocks: Are there other stocks that provide better prospects with proven track records? Explore our free list of these great stocks here.
NB: Figures in this article are calculated using data from the trailing twelve months from 31 March 2018. This may not be consistent with full year annual report figures.
To help readers see pass the short term volatility of the financial market, we aim to bring you a long-term focused research analysis purely driven by fundamental data. Note that our analysis does not factor in the latest price sensitive company announcements.
The author is an independent contributor and at the time of publication had no position in the stocks mentioned.
