
 Yahoo Finance
 Stitch Fix (NASDAQ:SFIX) investors are sitting on a loss of 74% if they invested five years ago
It is doubtless a positive to see that the Stitch Fix, Inc. (NASDAQ:SFIX) share price has gained some 81% in the last three months. But spare a thought for the long term holders, who have held the stock as it bled value over the last five years. Indeed, the share price is down a whopping 74% in that time. While the recent increase might be a green shoot, we're certainly hesitant to rejoice. The million dollar question is whether the company can justify a long term recovery.
Now let's have a look at the company's fundamentals, and see if the long term shareholder return has matched the performance of the underlying business.
Check out our latest analysis for Stitch Fix
Stitch Fix isn't currently profitable, so most analysts would look to revenue growth to get an idea of how fast the underlying business is growing. Generally speaking, companies without profits are expected to grow revenue every year, and at a good clip. Some companies are willing to postpone profitability to grow revenue faster, but in that case one does expect good top-line growth.
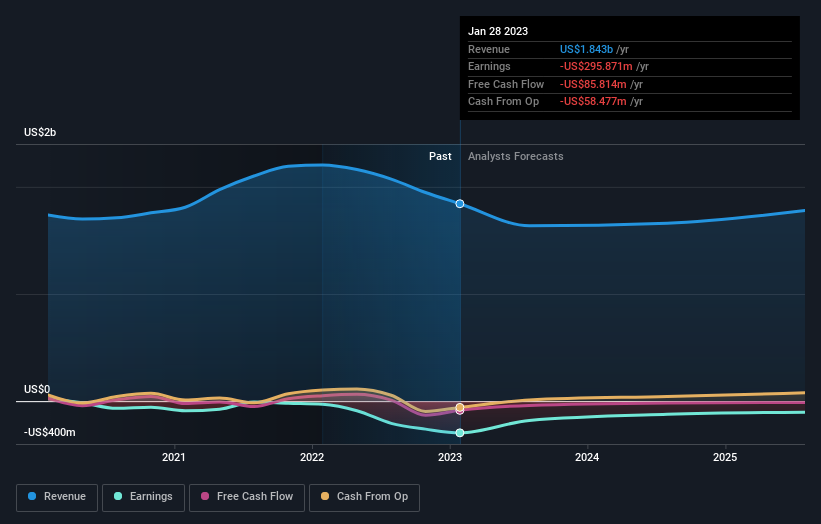
Over five years, Stitch Fix grew its revenue at 12% per year. That's a fairly respectable growth rate. So the stock price fall of 12% per year seems pretty steep. The truth is that the growth might be below expectations, and investors are probably worried about the continual losses.
You can see below how earnings and revenue have changed over time (discover the exact values by clicking on the image).
We consider it positive that insiders have made significant purchases in the last year. Having said that, most people consider earnings and revenue growth trends to be a more meaningful guide to the business. So it makes a lot of sense to check out what analysts think Stitch Fix will earn in the future (free profit forecasts).
A Different Perspective
We regret to report that Stitch Fix shareholders are down 48% for the year. Unfortunately, that's worse than the broader market decline of 13%. Having said that, it's inevitable that some stocks will be oversold in a falling market. The key is to keep your eyes on the fundamental developments. Unfortunately, last year's performance may indicate unresolved challenges, given that it was worse than the annualised loss of 12% over the last half decade. We realise that Baron Rothschild has said investors should "buy when there is blood on the streets", but we caution that investors should first be sure they are buying a high quality business. It's always interesting to track share price performance over the longer term. But to understand Stitch Fix better, we need to consider many other factors. Consider risks, for instance. Every company has them, and we've spotted 3 warning signs for Stitch Fix you should know about.
There are plenty of other companies that have insiders buying up shares. You probably do not want to miss this free list of growing companies that insiders are buying.
Please note, the market returns quoted in this article reflect the market weighted average returns of stocks that currently trade on American exchanges.
Have feedback on this article? Concerned about the content? Get in touch with us directly. Alternatively, email editorial-team (at) simplywallst.com.
This article by Simply Wall St is general in nature. We provide commentary based on historical data and analyst forecasts only using an unbiased methodology and our articles are not intended to be financial advice. It does not constitute a recommendation to buy or sell any stock, and does not take account of your objectives, or your financial situation. We aim to bring you long-term focused analysis driven by fundamental data. Note that our analysis may not factor in the latest price-sensitive company announcements or qualitative material. Simply Wall St has no position in any stocks mentioned.
Join A Paid User Research Session
You’ll receive a US$30 Amazon Gift card for 1 hour of your time while helping us build better investing tools for the individual investors like yourself. Sign up here
