
 Yahoo Finance
 Be Sure To Check Out CME Group Inc. (NASDAQ:CME) Before It Goes Ex-Dividend

Readers hoping to buy CME Group Inc. (NASDAQ:CME) for its dividend will need to make their move shortly, as the stock is about to trade ex-dividend. Ex-dividend means that investors that purchase the stock on or after the 9th of March will not receive this dividend, which will be paid on the 25th of March.
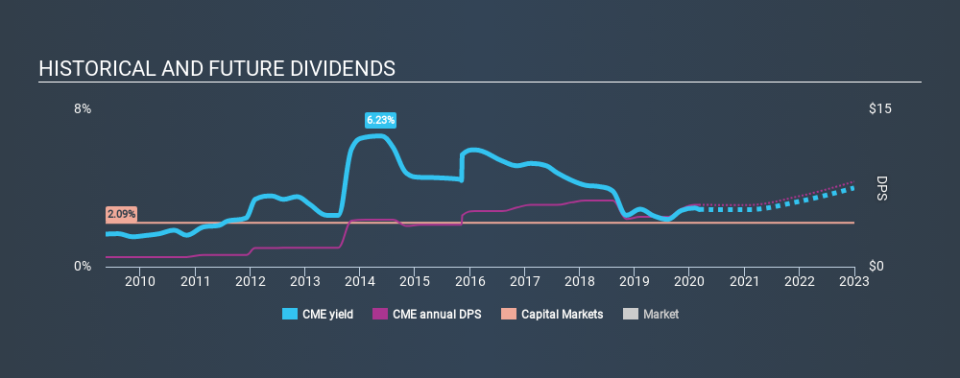
CME Group's upcoming dividend is US$0.85 a share, following on from the last 12 months, when the company distributed a total of US$5.90 per share to shareholders. Looking at the last 12 months of distributions, CME Group has a trailing yield of approximately 2.7% on its current stock price of $216.12. We love seeing companies pay a dividend, but it's also important to be sure that laying the golden eggs isn't going to kill our golden goose! As a result, readers should always check whether CME Group has been able to grow its dividends, or if the dividend might be cut.
Check out our latest analysis for CME Group
If a company pays out more in dividends than it earned, then the dividend might become unsustainable - hardly an ideal situation. CME Group paid out 51% of its earnings to investors last year, a normal payout level for most businesses.
When a company paid out less in dividends than it earned in profit, this generally suggests its dividend is affordable. The lower the % of its profit that it pays out, the greater the margin of safety for the dividend if the business enters a downturn.
Click here to see the company's payout ratio, plus analyst estimates of its future dividends.
Have Earnings And Dividends Been Growing?
Stocks in companies that generate sustainable earnings growth often make the best dividend prospects, as it is easier to lift the dividend when earnings are rising. Investors love dividends, so if earnings fall and the dividend is reduced, expect a stock to be sold off heavily at the same time. For this reason, we're glad to see CME Group's earnings per share have risen 12% per annum over the last five years.
The main way most investors will assess a company's dividend prospects is by checking the historical rate of dividend growth. In the past ten years, CME Group has increased its dividend at approximately 20% a year on average. Both per-share earnings and dividends have both been growing rapidly in recent times, which is great to see.
The Bottom Line
Has CME Group got what it takes to maintain its dividend payments? Earnings per share are growing nicely, and CME Group is paying out a percentage of its earnings that is around the average for dividend-paying stocks. In summary, CME Group appears to have some promise as a dividend stock, and we'd suggest taking a closer look at it.
So while CME Group looks good from a dividend perspective, it's always worthwhile being up to date with the risks involved in this stock. Every company has risks, and we've spotted 2 warning signs for CME Group you should know about.
If you're in the market for dividend stocks, we recommend checking our list of top dividend stocks with a greater than 2% yield and an upcoming dividend.
If you spot an error that warrants correction, please contact the editor at editorial-team@simplywallst.com. This article by Simply Wall St is general in nature. It does not constitute a recommendation to buy or sell any stock, and does not take account of your objectives, or your financial situation. Simply Wall St has no position in the stocks mentioned.
We aim to bring you long-term focused research analysis driven by fundamental data. Note that our analysis may not factor in the latest price-sensitive company announcements or qualitative material. Thank you for reading.
