
 Yahoo Finance
 Is Swiss Re AG's (VTX:SREN) Recent Price Movement Underpinned By Its Weak Fundamentals?
It is hard to get excited after looking at Swiss Re's (VTX:SREN) recent performance, when its stock has declined 5.9% over the past three months. We, however decided to study the company's financials to determine if they have got anything to do with the price decline. Long-term fundamentals are usually what drive market outcomes, so it's worth paying close attention. Particularly, we will be paying attention to Swiss Re's ROE today.
Return on equity or ROE is an important factor to be considered by a shareholder because it tells them how effectively their capital is being reinvested. Simply put, it is used to assess the profitability of a company in relation to its equity capital.
View our latest analysis for Swiss Re
How Is ROE Calculated?
Return on equity can be calculated by using the formula:
Return on Equity = Net Profit (from continuing operations) ÷ Shareholders' Equity
So, based on the above formula, the ROE for Swiss Re is:
3.7% = US$480m ÷ US$13b (Based on the trailing twelve months to December 2022).
The 'return' is the yearly profit. Another way to think of that is that for every CHF1 worth of equity, the company was able to earn CHF0.04 in profit.
What Is The Relationship Between ROE And Earnings Growth?
So far, we've learned that ROE is a measure of a company's profitability. Based on how much of its profits the company chooses to reinvest or "retain", we are then able to evaluate a company's future ability to generate profits. Assuming all else is equal, companies that have both a higher return on equity and higher profit retention are usually the ones that have a higher growth rate when compared to companies that don't have the same features.
A Side By Side comparison of Swiss Re's Earnings Growth And 3.7% ROE
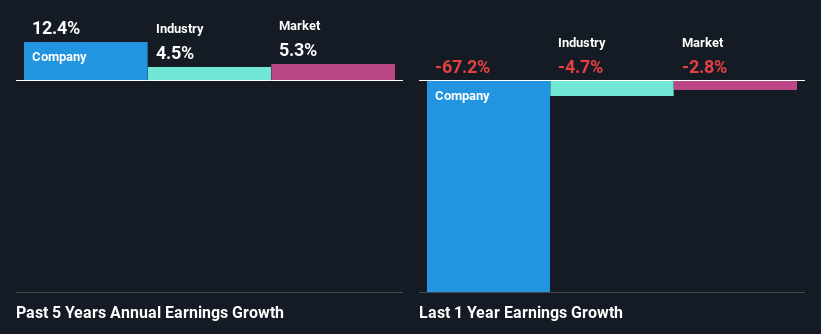
At first glance, Swiss Re's ROE doesn't look very promising. We then compared the company's ROE to the broader industry and were disappointed to see that the ROE is lower than the industry average of 13%. Although, we can see that Swiss Re saw a modest net income growth of 12% over the past five years. So, the growth in the company's earnings could probably have been caused by other variables. For instance, the company has a low payout ratio or is being managed efficiently.
Next, on comparing with the industry net income growth, we found that Swiss Re's growth is quite high when compared to the industry average growth of 4.5% in the same period, which is great to see.
Earnings growth is a huge factor in stock valuation. The investor should try to establish if the expected growth or decline in earnings, whichever the case may be, is priced in. By doing so, they will have an idea if the stock is headed into clear blue waters or if swampy waters await. One good indicator of expected earnings growth is the P/E ratio which determines the price the market is willing to pay for a stock based on its earnings prospects. So, you may want to check if Swiss Re is trading on a high P/E or a low P/E, relative to its industry.
Is Swiss Re Using Its Retained Earnings Effectively?
Swiss Re's high three-year median payout ratio of 139% suggests that the company is paying out more to its shareholders than what it is making. In spite of this, the company was able to grow its earnings respectably, as we saw above. It would still be worth keeping an eye on that high payout ratio, if for some reason the company runs into problems and business deteriorates. To know the 2 risks we have identified for Swiss Re visit our risks dashboard for free.
Moreover, Swiss Re is determined to keep sharing its profits with shareholders which we infer from its long history of paying a dividend for at least ten years. Our latest analyst data shows that the future payout ratio of the company is expected to drop to 58% over the next three years. Accordingly, the expected drop in the payout ratio explains the expected increase in the company's ROE to 22%, over the same period.
Conclusion
In total, we're a bit ambivalent about Swiss Re's performance. While no doubt its earnings growth is pretty substantial, its ROE and earnings retention is quite poor. So while the company has managed to grow its earnings in spite of this, we are unconvinced if this growth could extend, especially during troubled times. With that said, the latest industry analyst forecasts reveal that the company's earnings are expected to accelerate. Are these analysts expectations based on the broad expectations for the industry, or on the company's fundamentals? Click here to be taken to our analyst's forecasts page for the company.
Have feedback on this article? Concerned about the content? Get in touch with us directly. Alternatively, email editorial-team (at) simplywallst.com.
This article by Simply Wall St is general in nature. We provide commentary based on historical data and analyst forecasts only using an unbiased methodology and our articles are not intended to be financial advice. It does not constitute a recommendation to buy or sell any stock, and does not take account of your objectives, or your financial situation. We aim to bring you long-term focused analysis driven by fundamental data. Note that our analysis may not factor in the latest price-sensitive company announcements or qualitative material. Simply Wall St has no position in any stocks mentioned.
Join A Paid User Research Session
You’ll receive a US$30 Amazon Gift card for 1 hour of your time while helping us build better investing tools for the individual investors like yourself. Sign up here
