
 Yahoo Finance
 S&T Bancorp (NASDAQ:STBA) investors are sitting on a loss of 1.1% if they invested five years ago
For many, the main point of investing is to generate higher returns than the overall market. But the main game is to find enough winners to more than offset the losers So we wouldn't blame long term S&T Bancorp, Inc. (NASDAQ:STBA) shareholders for doubting their decision to hold, with the stock down 19% over a half decade.
With that in mind, it's worth seeing if the company's underlying fundamentals have been the driver of long term performance, or if there are some discrepancies.
Check out our latest analysis for S&T Bancorp
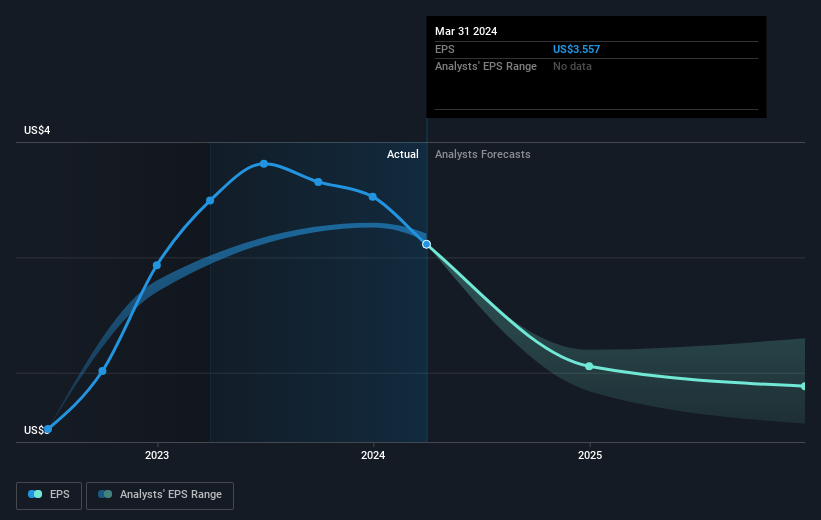
While markets are a powerful pricing mechanism, share prices reflect investor sentiment, not just underlying business performance. By comparing earnings per share (EPS) and share price changes over time, we can get a feel for how investor attitudes to a company have morphed over time.
During the unfortunate half decade during which the share price slipped, S&T Bancorp actually saw its earnings per share (EPS) improve by 3.9% per year. So it doesn't seem like EPS is a great guide to understanding how the market is valuing the stock. Alternatively, growth expectations may have been unreasonable in the past.
Given that EPS has increased, but the share price has fallen, it's fair to say that market sentiment around the stock has become more negative. Generally speaking, though, if the company can keep growing EPS then the share price will eventually follow.
You can see how EPS has changed over time in the image below (click on the chart to see the exact values).
We know that S&T Bancorp has improved its bottom line over the last three years, but what does the future have in store? It might be well worthwhile taking a look at our free report on how its financial position has changed over time.
What About Dividends?
When looking at investment returns, it is important to consider the difference between total shareholder return (TSR) and share price return. The TSR incorporates the value of any spin-offs or discounted capital raisings, along with any dividends, based on the assumption that the dividends are reinvested. So for companies that pay a generous dividend, the TSR is often a lot higher than the share price return. We note that for S&T Bancorp the TSR over the last 5 years was -1.1%, which is better than the share price return mentioned above. The dividends paid by the company have thusly boosted the total shareholder return.
A Different Perspective
S&T Bancorp shareholders are up 6.8% for the year (even including dividends). Unfortunately this falls short of the market return. But at least that's still a gain! Over five years the TSR has been a reduction of 0.2% per year, over five years. It could well be that the business is stabilizing. It's always interesting to track share price performance over the longer term. But to understand S&T Bancorp better, we need to consider many other factors. To that end, you should learn about the 2 warning signs we've spotted with S&T Bancorp (including 1 which doesn't sit too well with us) .
But note: S&T Bancorp may not be the best stock to buy. So take a peek at this free list of interesting companies with past earnings growth (and further growth forecast).
Please note, the market returns quoted in this article reflect the market weighted average returns of stocks that currently trade on American exchanges.
Have feedback on this article? Concerned about the content? Get in touch with us directly. Alternatively, email editorial-team (at) simplywallst.com.
This article by Simply Wall St is general in nature. We provide commentary based on historical data and analyst forecasts only using an unbiased methodology and our articles are not intended to be financial advice. It does not constitute a recommendation to buy or sell any stock, and does not take account of your objectives, or your financial situation. We aim to bring you long-term focused analysis driven by fundamental data. Note that our analysis may not factor in the latest price-sensitive company announcements or qualitative material. Simply Wall St has no position in any stocks mentioned.
Have feedback on this article? Concerned about the content? Get in touch with us directly. Alternatively, email editorial-team@simplywallst.com
