
 Yahoo Finance
 T-Mobile US (NASDAQ:TMUS) Takes On Some Risk With Its Use Of Debt
The external fund manager backed by Berkshire Hathaway's Charlie Munger, Li Lu, makes no bones about it when he says 'The biggest investment risk is not the volatility of prices, but whether you will suffer a permanent loss of capital.' So it might be obvious that you need to consider debt, when you think about how risky any given stock is, because too much debt can sink a company. Importantly, T-Mobile US, Inc. (NASDAQ:TMUS) does carry debt. But the more important question is: how much risk is that debt creating?
When Is Debt Dangerous?
Debt assists a business until the business has trouble paying it off, either with new capital or with free cash flow. In the worst case scenario, a company can go bankrupt if it cannot pay its creditors. However, a more usual (but still expensive) situation is where a company must dilute shareholders at a cheap share price simply to get debt under control. Of course, plenty of companies use debt to fund growth, without any negative consequences. When we examine debt levels, we first consider both cash and debt levels, together.
Check out our latest analysis for T-Mobile US
What Is T-Mobile US's Net Debt?
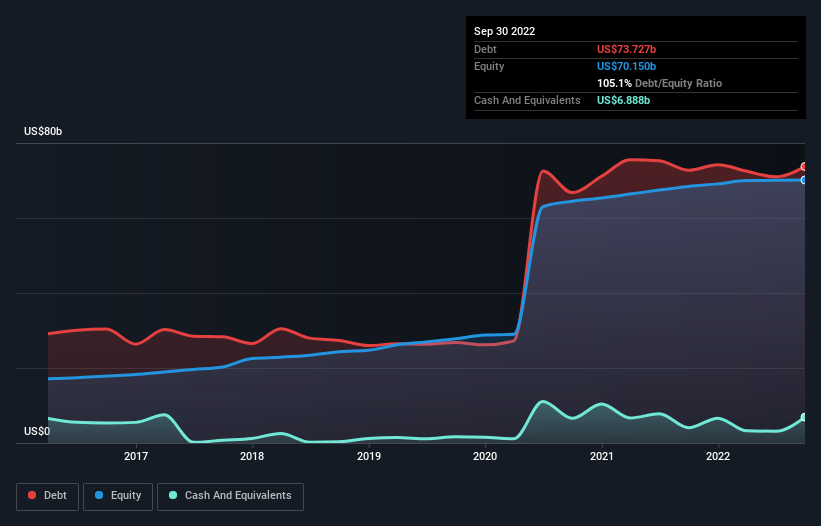
The chart below, which you can click on for greater detail, shows that T-Mobile US had US$73.7b in debt in September 2022; about the same as the year before. On the flip side, it has US$6.89b in cash leading to net debt of about US$66.8b.
A Look At T-Mobile US' Liabilities
The latest balance sheet data shows that T-Mobile US had liabilities of US$26.4b due within a year, and liabilities of US$117.0b falling due after that. Offsetting these obligations, it had cash of US$6.89b as well as receivables valued at US$9.59b due within 12 months. So its liabilities total US$126.9b more than the combination of its cash and short-term receivables.
This is a mountain of leverage even relative to its gargantuan market capitalization of US$174.1b. Should its lenders demand that it shore up the balance sheet, shareholders would likely face severe dilution.
We use two main ratios to inform us about debt levels relative to earnings. The first is net debt divided by earnings before interest, tax, depreciation, and amortization (EBITDA), while the second is how many times its earnings before interest and tax (EBIT) covers its interest expense (or its interest cover, for short). The advantage of this approach is that we take into account both the absolute quantum of debt (with net debt to EBITDA) and the actual interest expenses associated with that debt (with its interest cover ratio).
T-Mobile US's debt is 2.5 times its EBITDA, and its EBIT cover its interest expense 3.7 times over. Taken together this implies that, while we wouldn't want to see debt levels rise, we think it can handle its current leverage. We note that T-Mobile US grew its EBIT by 23% in the last year, and that should make it easier to pay down debt, going forward. The balance sheet is clearly the area to focus on when you are analysing debt. But it is future earnings, more than anything, that will determine T-Mobile US's ability to maintain a healthy balance sheet going forward. So if you're focused on the future you can check out this free report showing analyst profit forecasts.
Finally, while the tax-man may adore accounting profits, lenders only accept cold hard cash. So we always check how much of that EBIT is translated into free cash flow. During the last three years, T-Mobile US burned a lot of cash. While investors are no doubt expecting a reversal of that situation in due course, it clearly does mean its use of debt is more risky.
Our View
Mulling over T-Mobile US's attempt at converting EBIT to free cash flow, we're certainly not enthusiastic. But on the bright side, its EBIT growth rate is a good sign, and makes us more optimistic. Once we consider all the factors above, together, it seems to us that T-Mobile US's debt is making it a bit risky. Some people like that sort of risk, but we're mindful of the potential pitfalls, so we'd probably prefer it carry less debt. There's no doubt that we learn most about debt from the balance sheet. But ultimately, every company can contain risks that exist outside of the balance sheet. For example, we've discovered 4 warning signs for T-Mobile US that you should be aware of before investing here.
At the end of the day, it's often better to focus on companies that are free from net debt. You can access our special list of such companies (all with a track record of profit growth). It's free.
Have feedback on this article? Concerned about the content? Get in touch with us directly. Alternatively, email editorial-team (at) simplywallst.com.
This article by Simply Wall St is general in nature. We provide commentary based on historical data and analyst forecasts only using an unbiased methodology and our articles are not intended to be financial advice. It does not constitute a recommendation to buy or sell any stock, and does not take account of your objectives, or your financial situation. We aim to bring you long-term focused analysis driven by fundamental data. Note that our analysis may not factor in the latest price-sensitive company announcements or qualitative material. Simply Wall St has no position in any stocks mentioned.
Join A Paid User Research Session
You’ll receive a US$30 Amazon Gift card for 1 hour of your time while helping us build better investing tools for the individual investors like yourself. Sign up here
