
 Yahoo Finance
 Target Healthcare REIT's(LON:THRL) Share Price Is Down 11% Over The Past Three Years.

No-one enjoys it when they lose money on a stock. But it can difficult to make money in a declining market. While the Target Healthcare REIT PLC (LON:THRL) share price is down 11% in the last three years, the total return to shareholders (which includes dividends) was 6.7%. That's better than the market which declined 8.2% over the last three years. There was little comfort for shareholders in the last week as the price declined a further 1.7%.
View our latest analysis for Target Healthcare REIT
There is no denying that markets are sometimes efficient, but prices do not always reflect underlying business performance. One flawed but reasonable way to assess how sentiment around a company has changed is to compare the earnings per share (EPS) with the share price.
During the three years that the share price fell, Target Healthcare REIT's earnings per share (EPS) dropped by 1.8% each year. This reduction in EPS is slower than the 4% annual reduction in the share price. So it's likely that the EPS decline has disappointed the market, leaving investors hesitant to buy.
You can see below how EPS has changed over time (discover the exact values by clicking on the image).
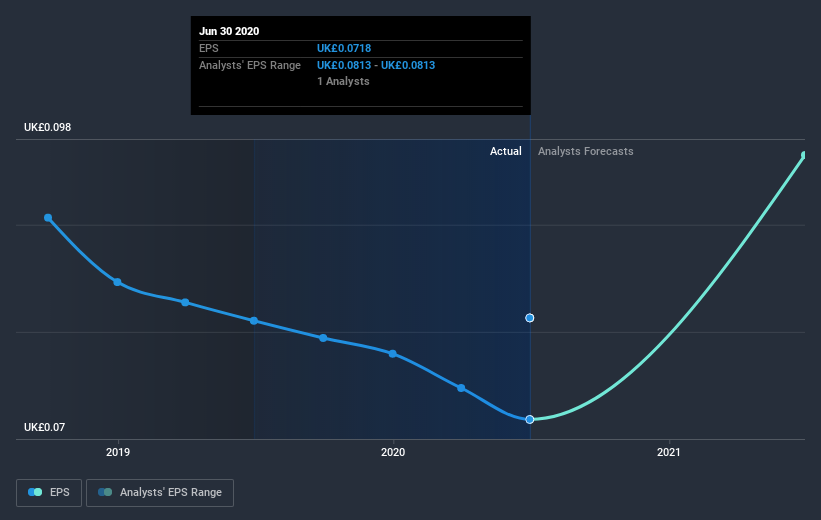
This free interactive report on Target Healthcare REIT's earnings, revenue and cash flow is a great place to start, if you want to investigate the stock further.
What About Dividends?
When looking at investment returns, it is important to consider the difference between total shareholder return (TSR) and share price return. Whereas the share price return only reflects the change in the share price, the TSR includes the value of dividends (assuming they were reinvested) and the benefit of any discounted capital raising or spin-off. It's fair to say that the TSR gives a more complete picture for stocks that pay a dividend. We note that for Target Healthcare REIT the TSR over the last 3 years was 6.7%, which is better than the share price return mentioned above. And there's no prize for guessing that the dividend payments largely explain the divergence!
A Different Perspective
While it's certainly disappointing to see that Target Healthcare REIT shares lost 2.9% throughout the year, that wasn't as bad as the market loss of 11%. Of course, the long term returns are far more important and the good news is that over five years, the stock has returned 5% for each year. In the best case scenario the last year is just a temporary blip on the journey to a brighter future. While it is well worth considering the different impacts that market conditions can have on the share price, there are other factors that are even more important. Consider for instance, the ever-present spectre of investment risk. We've identified 1 warning sign with Target Healthcare REIT , and understanding them should be part of your investment process.
If you would prefer to check out another company -- one with potentially superior financials -- then do not miss this free list of companies that have proven they can grow earnings.
Please note, the market returns quoted in this article reflect the market weighted average returns of stocks that currently trade on GB exchanges.
This article by Simply Wall St is general in nature. It does not constitute a recommendation to buy or sell any stock, and does not take account of your objectives, or your financial situation. We aim to bring you long-term focused analysis driven by fundamental data. Note that our analysis may not factor in the latest price-sensitive company announcements or qualitative material. Simply Wall St has no position in any stocks mentioned.
Have feedback on this article? Concerned about the content? Get in touch with us directly. Alternatively, email editorial-team@simplywallst.com.
