
 Yahoo Finance
 Is Tecogen Inc’s (NASDAQ:TGEN) Balance Sheet Strong Enough To Weather A Storm?

Investors are always looking for growth in small-cap stocks like Tecogen Inc (NASDAQ:TGEN), with a market cap of US$88.36m. However, an important fact which most ignore is: how financially healthy is the business? Evaluating financial health as part of your investment thesis is crucial, as mismanagement of capital can lead to bankruptcies, which occur at a higher rate for small-caps. Here are few basic financial health checks you should consider before taking the plunge. However, this commentary is still very high-level, so I’d encourage you to dig deeper yourself into TGEN here.
How much cash does TGEN generate through its operations?
TGEN has shrunken its total debt levels in the last twelve months, from US$3.15m to US$850.00k , which is made up of current and long term debt. With this reduction in debt, TGEN currently has US$1.67m remaining in cash and short-term investments for investing into the business. Moving onto cash from operations, its small level of operating cash flow means calculating cash-to-debt wouldn’t be too useful, though these low levels of cash means that operational efficiency is worth a look. As the purpose of this article is a high-level overview, I won’t be looking at this today, but you can examine some of TGEN’s operating efficiency ratios such as ROA here.
Can TGEN meet its short-term obligations with the cash in hand?
At the current liabilities level of US$8.71m liabilities, it seems that the business has been able to meet these obligations given the level of current assets of US$21.66m, with a current ratio of 2.49x. Generally, for Building companies, this is a reasonable ratio as there’s enough of a cash buffer without holding too capital in low return investments.
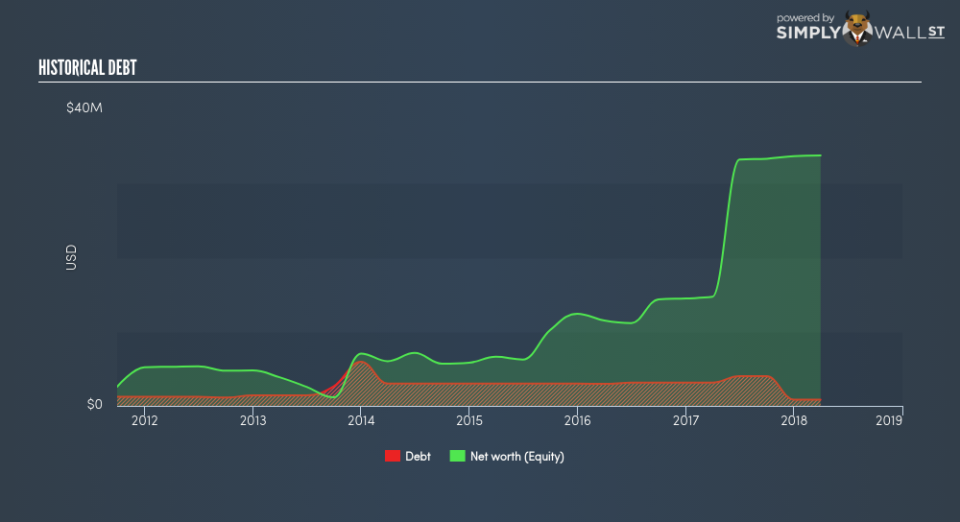
Is TGEN’s debt level acceptable?
With a debt-to-equity ratio of 2.51%, TGEN’s debt level is relatively low. This range is considered safe as TGEN is not taking on too much debt obligation, which can be restrictive and risky for equity-holders. We can check to see whether TGEN is able to meet its debt obligations by looking at the net interest coverage ratio. A company generating earnings before interest and tax (EBIT) at least three times its net interest payments is considered financially sound. In TGEN’s, case, the ratio of 5.45x suggests that interest is appropriately covered, which means that debtors may be willing to loan the company more money, giving TGEN ample headroom to grow its debt facilities.
Next Steps:
TGEN’s cash flow coverage indicates it could improve its operating efficiency in order to meet demand for debt repayments should unforeseen events arise. However, the company exhibits an ability to meet its near term obligations should an adverse event occur. I admit this is a fairly basic analysis for TGEN’s financial health. Other important fundamentals need to be considered alongside. You should continue to research Tecogen to get a more holistic view of the stock by looking at:
Future Outlook: What are well-informed industry analysts predicting for TGEN’s future growth? Take a look at our free research report of analyst consensus for TGEN’s outlook.
Valuation: What is TGEN worth today? Is the stock undervalued, even when its growth outlook is factored into its intrinsic value? The intrinsic value infographic in our free research report helps visualize whether TGEN is currently mispriced by the market.
Other High-Performing Stocks: Are there other stocks that provide better prospects with proven track records? Explore our free list of these great stocks here.
To help readers see pass the short term volatility of the financial market, we aim to bring you a long-term focused research analysis purely driven by fundamental data. Note that our analysis does not factor in the latest price sensitive company announcements.
The author is an independent contributor and at the time of publication had no position in the stocks mentioned.
