
 Yahoo Finance
 There's Reason For Concern Over Chegg, Inc.'s (NYSE:CHGG) Price
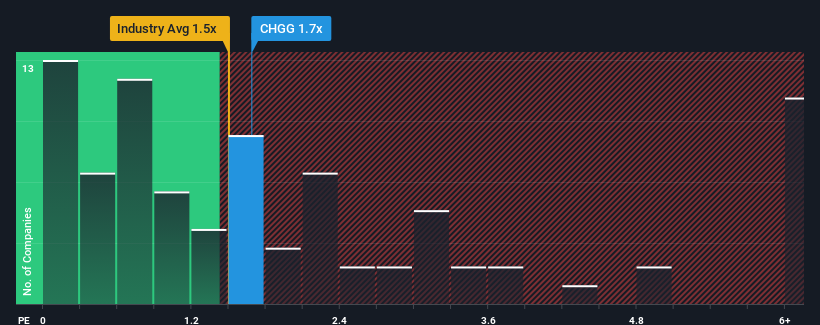
With a median price-to-sales (or "P/S") ratio of close to 1.5x in the Consumer Services industry in the United States, you could be forgiven for feeling indifferent about Chegg, Inc.'s (NYSE:CHGG) P/S ratio of 1.7x. Although, it's not wise to simply ignore the P/S without explanation as investors may be disregarding a distinct opportunity or a costly mistake.
See our latest analysis for Chegg
How Has Chegg Performed Recently?
Chegg hasn't been tracking well recently as its declining revenue compares poorly to other companies, which have seen some growth in their revenues on average. One possibility is that the P/S ratio is moderate because investors think this poor revenue performance will turn around. However, if this isn't the case, investors might get caught out paying too much for the stock.
If you'd like to see what analysts are forecasting going forward, you should check out our free report on Chegg.
What Are Revenue Growth Metrics Telling Us About The P/S?
Chegg's P/S ratio would be typical for a company that's only expected to deliver moderate growth, and importantly, perform in line with the industry.
In reviewing the last year of financials, we were disheartened to see the company's revenues fell to the tune of 4.6%. However, a few very strong years before that means that it was still able to grow revenue by an impressive 30% in total over the last three years. Although it's been a bumpy ride, it's still fair to say the revenue growth recently has been more than adequate for the company.
Looking ahead now, revenue is anticipated to slump, contracting by 3.0% during the coming year according to the analysts following the company. With the industry predicted to deliver 13% growth, that's a disappointing outcome.
With this information, we find it concerning that Chegg is trading at a fairly similar P/S compared to the industry. It seems most investors are hoping for a turnaround in the company's business prospects, but the analyst cohort is not so confident this will happen. Only the boldest would assume these prices are sustainable as these declining revenues are likely to weigh on the share price eventually.
What Does Chegg's P/S Mean For Investors?
We'd say the price-to-sales ratio's power isn't primarily as a valuation instrument but rather to gauge current investor sentiment and future expectations.
Our check of Chegg's analyst forecasts revealed that its outlook for shrinking revenue isn't bringing down its P/S as much as we would have predicted. With this in mind, we don't feel the current P/S is justified as declining revenues are unlikely to support a more positive sentiment for long. If the declining revenues were to materialize in the form of a declining share price, shareholders will be feeling the pinch.
And what about other risks? Every company has them, and we've spotted 3 warning signs for Chegg (of which 1 is concerning!) you should know about.
If companies with solid past earnings growth is up your alley, you may wish to see this free collection of other companies with strong earnings growth and low P/E ratios.
Have feedback on this article? Concerned about the content? Get in touch with us directly. Alternatively, email editorial-team (at) simplywallst.com.
This article by Simply Wall St is general in nature. We provide commentary based on historical data and analyst forecasts only using an unbiased methodology and our articles are not intended to be financial advice. It does not constitute a recommendation to buy or sell any stock, and does not take account of your objectives, or your financial situation. We aim to bring you long-term focused analysis driven by fundamental data. Note that our analysis may not factor in the latest price-sensitive company announcements or qualitative material. Simply Wall St has no position in any stocks mentioned.
