
 Yahoo Finance
 We Think Goldplat (LON:GDP) Might Have The DNA Of A Multi-Bagger
Did you know there are some financial metrics that can provide clues of a potential multi-bagger? Ideally, a business will show two trends; firstly a growing return on capital employed (ROCE) and secondly, an increasing amount of capital employed. Ultimately, this demonstrates that it's a business that is reinvesting profits at increasing rates of return. With that in mind, the ROCE of Goldplat (LON:GDP) looks great, so lets see what the trend can tell us.
What Is Return On Capital Employed (ROCE)?
For those that aren't sure what ROCE is, it measures the amount of pre-tax profits a company can generate from the capital employed in its business. The formula for this calculation on Goldplat is:
Return on Capital Employed = Earnings Before Interest and Tax (EBIT) ÷ (Total Assets - Current Liabilities)
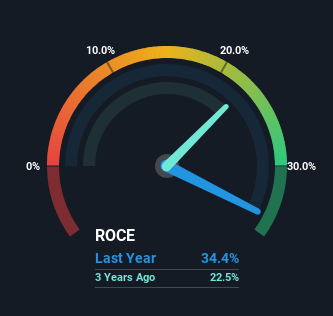
0.34 = UK£7.2m ÷ (UK£48m - UK£27m) (Based on the trailing twelve months to December 2022).
Thus, Goldplat has an ROCE of 34%. In absolute terms that's a great return and it's even better than the Metals and Mining industry average of 11%.
Check out our latest analysis for Goldplat
In the above chart we have measured Goldplat's prior ROCE against its prior performance, but the future is arguably more important. If you're interested, you can view the analysts predictions in our free report on analyst forecasts for the company.
What The Trend Of ROCE Can Tell Us
Goldplat's ROCE growth is quite impressive. The figures show that over the last five years, ROCE has grown 131% whilst employing roughly the same amount of capital. So it's likely that the business is now reaping the full benefits of its past investments, since the capital employed hasn't changed considerably. The company is doing well in that sense, and it's worth investigating what the management team has planned for long term growth prospects.
On a side note, we noticed that the improvement in ROCE appears to be partly fueled by an increase in current liabilities. Essentially the business now has suppliers or short-term creditors funding about 57% of its operations, which isn't ideal. Given it's pretty high ratio, we'd remind investors that having current liabilities at those levels can bring about some risks in certain businesses.
The Bottom Line
To sum it up, Goldplat is collecting higher returns from the same amount of capital, and that's impressive. Since the stock has only returned 24% to shareholders over the last five years, the promising fundamentals may not be recognized yet by investors. So with that in mind, we think the stock deserves further research.
If you want to continue researching Goldplat, you might be interested to know about the 1 warning sign that our analysis has discovered.
If you'd like to see other companies earning high returns, check out our free list of companies earning high returns with solid balance sheets here.
Have feedback on this article? Concerned about the content? Get in touch with us directly. Alternatively, email editorial-team (at) simplywallst.com.
This article by Simply Wall St is general in nature. We provide commentary based on historical data and analyst forecasts only using an unbiased methodology and our articles are not intended to be financial advice. It does not constitute a recommendation to buy or sell any stock, and does not take account of your objectives, or your financial situation. We aim to bring you long-term focused analysis driven by fundamental data. Note that our analysis may not factor in the latest price-sensitive company announcements or qualitative material. Simply Wall St has no position in any stocks mentioned.
