
 Yahoo Finance
 Those who invested in ADENTRA (TSE:ADEN) five years ago are up 234%
ADENTRA Inc. (TSE:ADEN) shareholders have seen the share price descend 13% over the month. But that doesn't change the fact that the returns over the last five years have been very strong. We think most investors would be happy with the 206% return, over that period. Generally speaking the long term returns will give you a better idea of business quality than short periods can. Ultimately business performance will determine whether the stock price continues the positive long term trend.
So let's assess the underlying fundamentals over the last 5 years and see if they've moved in lock-step with shareholder returns.
View our latest analysis for ADENTRA
There is no denying that markets are sometimes efficient, but prices do not always reflect underlying business performance. One imperfect but simple way to consider how the market perception of a company has shifted is to compare the change in the earnings per share (EPS) with the share price movement.
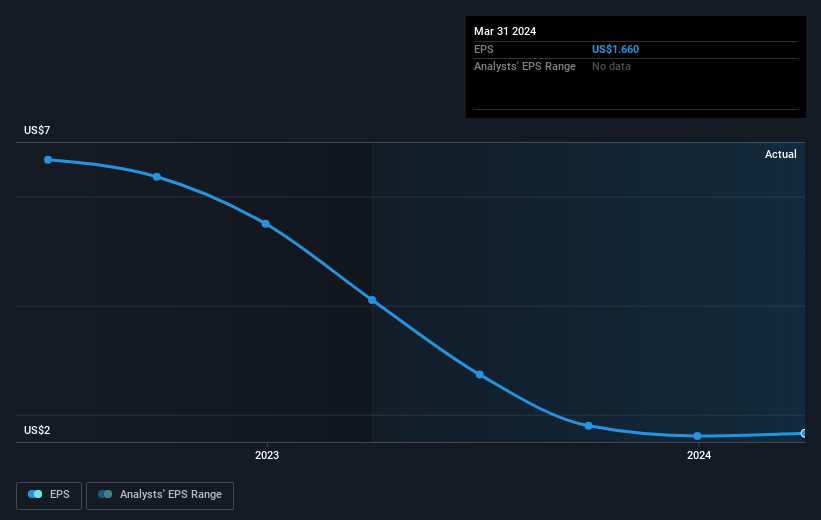
Over half a decade, ADENTRA managed to grow its earnings per share at 9.9% a year. This EPS growth is lower than the 25% average annual increase in the share price. This suggests that market participants hold the company in higher regard, these days. That's not necessarily surprising considering the five-year track record of earnings growth.
The company's earnings per share (over time) is depicted in the image below (click to see the exact numbers).
It's good to see that there was some significant insider buying in the last three months. That's a positive. That said, we think earnings and revenue growth trends are even more important factors to consider. Dive deeper into the earnings by checking this interactive graph of ADENTRA's earnings, revenue and cash flow.
What About Dividends?
As well as measuring the share price return, investors should also consider the total shareholder return (TSR). Whereas the share price return only reflects the change in the share price, the TSR includes the value of dividends (assuming they were reinvested) and the benefit of any discounted capital raising or spin-off. It's fair to say that the TSR gives a more complete picture for stocks that pay a dividend. As it happens, ADENTRA's TSR for the last 5 years was 234%, which exceeds the share price return mentioned earlier. This is largely a result of its dividend payments!
A Different Perspective
We're pleased to report that ADENTRA shareholders have received a total shareholder return of 37% over one year. That's including the dividend. That's better than the annualised return of 27% over half a decade, implying that the company is doing better recently. Someone with an optimistic perspective could view the recent improvement in TSR as indicating that the business itself is getting better with time. While it is well worth considering the different impacts that market conditions can have on the share price, there are other factors that are even more important. To that end, you should learn about the 2 warning signs we've spotted with ADENTRA (including 1 which is a bit unpleasant) .
ADENTRA is not the only stock insiders are buying. So take a peek at this free list of small cap companies at attractive valuations which insiders have been buying.
Please note, the market returns quoted in this article reflect the market weighted average returns of stocks that currently trade on Canadian exchanges.
Have feedback on this article? Concerned about the content? Get in touch with us directly. Alternatively, email editorial-team (at) simplywallst.com.
This article by Simply Wall St is general in nature. We provide commentary based on historical data and analyst forecasts only using an unbiased methodology and our articles are not intended to be financial advice. It does not constitute a recommendation to buy or sell any stock, and does not take account of your objectives, or your financial situation. We aim to bring you long-term focused analysis driven by fundamental data. Note that our analysis may not factor in the latest price-sensitive company announcements or qualitative material. Simply Wall St has no position in any stocks mentioned.