
 Yahoo Finance
 Those who invested in American International Group (NYSE:AIG) three years ago are up 33%
By buying an index fund, you can roughly match the market return with ease. But many of us dare to dream of bigger returns, and build a portfolio ourselves. Just take a look at American International Group, Inc. (NYSE:AIG), which is up 22%, over three years, soundly beating the market return of 13% (not including dividends). On the other hand, the returns haven't been quite so good recently, with shareholders up just 13% , including dividends .
So let's assess the underlying fundamentals over the last 3 years and see if they've moved in lock-step with shareholder returns.
View our latest analysis for American International Group
While markets are a powerful pricing mechanism, share prices reflect investor sentiment, not just underlying business performance. One imperfect but simple way to consider how the market perception of a company has shifted is to compare the change in the earnings per share (EPS) with the share price movement.
American International Group was able to grow its EPS at 109% per year over three years, sending the share price higher. This EPS growth is higher than the 7% average annual increase in the share price. So it seems investors have become more cautious about the company, over time. This cautious sentiment is reflected in its (fairly low) P/E ratio of 3.40.
You can see below how EPS has changed over time (discover the exact values by clicking on the image).
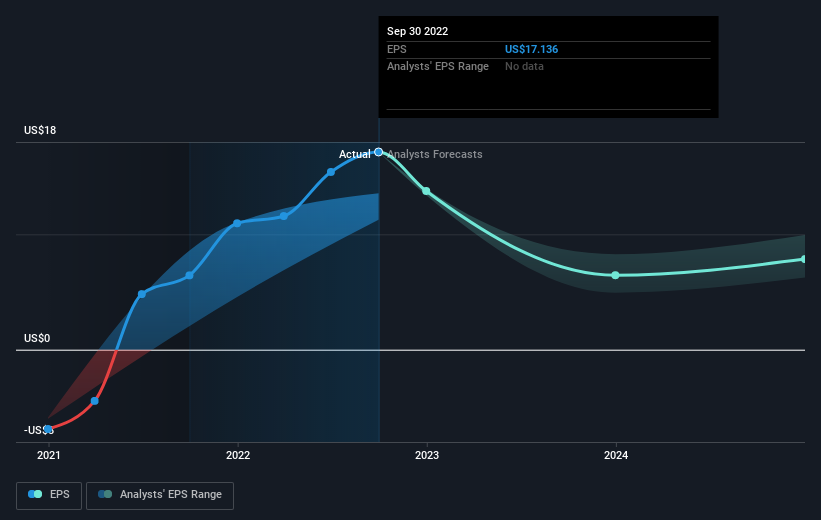
We know that American International Group has improved its bottom line over the last three years, but what does the future have in store? It might be well worthwhile taking a look at our free report on how its financial position has changed over time.
What About Dividends?
It is important to consider the total shareholder return, as well as the share price return, for any given stock. Whereas the share price return only reflects the change in the share price, the TSR includes the value of dividends (assuming they were reinvested) and the benefit of any discounted capital raising or spin-off. Arguably, the TSR gives a more comprehensive picture of the return generated by a stock. In the case of American International Group, it has a TSR of 33% for the last 3 years. That exceeds its share price return that we previously mentioned. And there's no prize for guessing that the dividend payments largely explain the divergence!
A Different Perspective
We're pleased to report that American International Group shareholders have received a total shareholder return of 13% over one year. That's including the dividend. Since the one-year TSR is better than the five-year TSR (the latter coming in at 4% per year), it would seem that the stock's performance has improved in recent times. Someone with an optimistic perspective could view the recent improvement in TSR as indicating that the business itself is getting better with time. I find it very interesting to look at share price over the long term as a proxy for business performance. But to truly gain insight, we need to consider other information, too. Even so, be aware that American International Group is showing 2 warning signs in our investment analysis , and 1 of those is a bit unpleasant...
But note: American International Group may not be the best stock to buy. So take a peek at this free list of interesting companies with past earnings growth (and further growth forecast).
Please note, the market returns quoted in this article reflect the market weighted average returns of stocks that currently trade on US exchanges.
Have feedback on this article? Concerned about the content? Get in touch with us directly. Alternatively, email editorial-team (at) simplywallst.com.
This article by Simply Wall St is general in nature. We provide commentary based on historical data and analyst forecasts only using an unbiased methodology and our articles are not intended to be financial advice. It does not constitute a recommendation to buy or sell any stock, and does not take account of your objectives, or your financial situation. We aim to bring you long-term focused analysis driven by fundamental data. Note that our analysis may not factor in the latest price-sensitive company announcements or qualitative material. Simply Wall St has no position in any stocks mentioned.
Join A Paid User Research Session
You’ll receive a US$30 Amazon Gift card for 1 hour of your time while helping us build better investing tools for the individual investors like yourself. Sign up here
