
 Yahoo Finance
 Those who invested in Bank of America (NYSE:BAC) a year ago are up 45%
These days it's easy to simply buy an index fund, and your returns should (roughly) match the market. But you can significantly boost your returns by picking above-average stocks. For example, the Bank of America Corporation (NYSE:BAC) share price is up 41% in the last 1 year, clearly besting the market return of around 24% (not including dividends). If it can keep that out-performance up over the long term, investors will do very well! On the other hand, longer term shareholders have had a tougher run, with the stock falling 5.0% in three years.
With that in mind, it's worth seeing if the company's underlying fundamentals have been the driver of long term performance, or if there are some discrepancies.
Check out our latest analysis for Bank of America
To paraphrase Benjamin Graham: Over the short term the market is a voting machine, but over the long term it's a weighing machine. By comparing earnings per share (EPS) and share price changes over time, we can get a feel for how investor attitudes to a company have morphed over time.
During the last year, Bank of America actually saw its earnings per share drop 13%.
Given the share price gain, we doubt the market is measuring progress with EPS. Since the change in EPS doesn't seem to correlate with the change in share price, it's worth taking a look at other metrics.
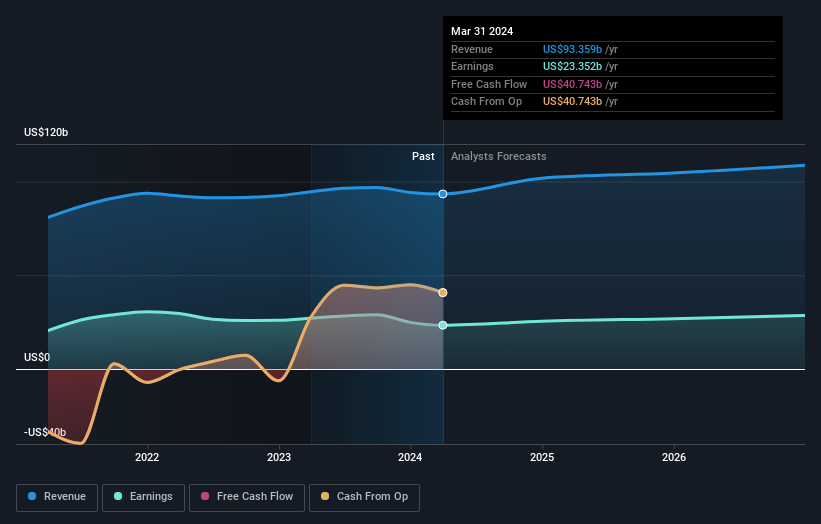
Revenue was pretty stable on last year, so deeper research might be needed to explain the share price rise.
The company's revenue and earnings (over time) are depicted in the image below (click to see the exact numbers).
We consider it positive that insiders have made significant purchases in the last year. Having said that, most people consider earnings and revenue growth trends to be a more meaningful guide to the business. This free report showing analyst forecasts should help you form a view on Bank of America
What About Dividends?
It is important to consider the total shareholder return, as well as the share price return, for any given stock. Whereas the share price return only reflects the change in the share price, the TSR includes the value of dividends (assuming they were reinvested) and the benefit of any discounted capital raising or spin-off. It's fair to say that the TSR gives a more complete picture for stocks that pay a dividend. As it happens, Bank of America's TSR for the last 1 year was 45%, which exceeds the share price return mentioned earlier. And there's no prize for guessing that the dividend payments largely explain the divergence!
A Different Perspective
We're pleased to report that Bank of America shareholders have received a total shareholder return of 45% over one year. That's including the dividend. That's better than the annualised return of 9% over half a decade, implying that the company is doing better recently. In the best case scenario, this may hint at some real business momentum, implying that now could be a great time to delve deeper. Investors who like to make money usually check up on insider purchases, such as the price paid, and total amount bought. You can find out about the insider purchases of Bank of America by clicking this link.
If you like to buy stocks alongside management, then you might just love this free list of companies. (Hint: most of them are flying under the radar).
Please note, the market returns quoted in this article reflect the market weighted average returns of stocks that currently trade on American exchanges.
Have feedback on this article? Concerned about the content? Get in touch with us directly. Alternatively, email editorial-team (at) simplywallst.com.
This article by Simply Wall St is general in nature. We provide commentary based on historical data and analyst forecasts only using an unbiased methodology and our articles are not intended to be financial advice. It does not constitute a recommendation to buy or sell any stock, and does not take account of your objectives, or your financial situation. We aim to bring you long-term focused analysis driven by fundamental data. Note that our analysis may not factor in the latest price-sensitive company announcements or qualitative material. Simply Wall St has no position in any stocks mentioned.
Have feedback on this article? Concerned about the content? Get in touch with us directly. Alternatively, email editorial-team@simplywallst.com
