
 Yahoo Finance
 Those who invested in Hanover Insurance Group (NYSE:THG) a year ago are up 14%
The Hanover Insurance Group, Inc. (NYSE:THG) shareholders might be concerned after seeing the share price drop 10% in the last quarter. Taking a longer term view we see the stock is up over one year. But to be blunt its return of 11% fall short of what you could have got from an index fund (around 25%).
Now it's worth having a look at the company's fundamentals too, because that will help us determine if the long term shareholder return has matched the performance of the underlying business.
View our latest analysis for Hanover Insurance Group
While markets are a powerful pricing mechanism, share prices reflect investor sentiment, not just underlying business performance. By comparing earnings per share (EPS) and share price changes over time, we can get a feel for how investor attitudes to a company have morphed over time.
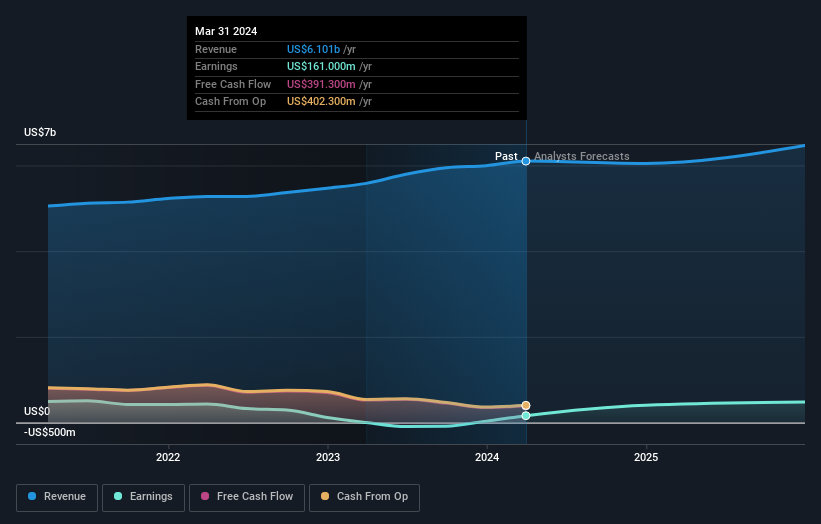
Hanover Insurance Group went from making a loss to reporting a profit, in the last year.
When a company has just transitioned to profitability, earnings per share growth is not always the best way to look at the share price action.
However the year on year revenue growth of 9.3% would help. Many businesses do go through a phase where they have to forgo some profits to drive business development, and sometimes its for the best.
The graphic below depicts how earnings and revenue have changed over time (unveil the exact values by clicking on the image).
We know that Hanover Insurance Group has improved its bottom line lately, but what does the future have in store? So we recommend checking out this free report showing consensus forecasts
What About Dividends?
It is important to consider the total shareholder return, as well as the share price return, for any given stock. The TSR is a return calculation that accounts for the value of cash dividends (assuming that any dividend received was reinvested) and the calculated value of any discounted capital raisings and spin-offs. Arguably, the TSR gives a more comprehensive picture of the return generated by a stock. We note that for Hanover Insurance Group the TSR over the last 1 year was 14%, which is better than the share price return mentioned above. This is largely a result of its dividend payments!
A Different Perspective
Hanover Insurance Group shareholders gained a total return of 14% during the year. But that was short of the market average. On the bright side, that's still a gain, and it's actually better than the average return of 1.7% over half a decade This could indicate that the company is winning over new investors, as it pursues its strategy. Before spending more time on Hanover Insurance Group it might be wise to click here to see if insiders have been buying or selling shares.
Of course Hanover Insurance Group may not be the best stock to buy. So you may wish to see this free collection of growth stocks.
Please note, the market returns quoted in this article reflect the market weighted average returns of stocks that currently trade on American exchanges.
Have feedback on this article? Concerned about the content? Get in touch with us directly. Alternatively, email editorial-team (at) simplywallst.com.
This article by Simply Wall St is general in nature. We provide commentary based on historical data and analyst forecasts only using an unbiased methodology and our articles are not intended to be financial advice. It does not constitute a recommendation to buy or sell any stock, and does not take account of your objectives, or your financial situation. We aim to bring you long-term focused analysis driven by fundamental data. Note that our analysis may not factor in the latest price-sensitive company announcements or qualitative material. Simply Wall St has no position in any stocks mentioned.
Have feedback on this article? Concerned about the content? Get in touch with us directly. Alternatively, email editorial-team@simplywallst.com
