
 Yahoo Finance
 Those who invested in Pfeiffer Vacuum Technology (ETR:PFV) five years ago are up 33%
Generally speaking the aim of active stock picking is to find companies that provide returns that are superior to the market average. And the truth is, you can make significant gains if you buy good quality businesses at the right price. For example, long term Pfeiffer Vacuum Technology AG (ETR:PFV) shareholders have enjoyed a 27% share price rise over the last half decade, well in excess of the market return of around 3.9% (not including dividends). On the other hand, the more recent gains haven't been so impressive, with shareholders gaining just 6.8%.
With that in mind, it's worth seeing if the company's underlying fundamentals have been the driver of long term performance, or if there are some discrepancies.
See our latest analysis for Pfeiffer Vacuum Technology
While markets are a powerful pricing mechanism, share prices reflect investor sentiment, not just underlying business performance. One way to examine how market sentiment has changed over time is to look at the interaction between a company's share price and its earnings per share (EPS).
Over half a decade, Pfeiffer Vacuum Technology managed to grow its earnings per share at 2.3% a year. This EPS growth is slower than the share price growth of 5% per year, over the same period. This suggests that market participants hold the company in higher regard, these days. That's not necessarily surprising considering the five-year track record of earnings growth.
The graphic below depicts how EPS has changed over time (unveil the exact values by clicking on the image).
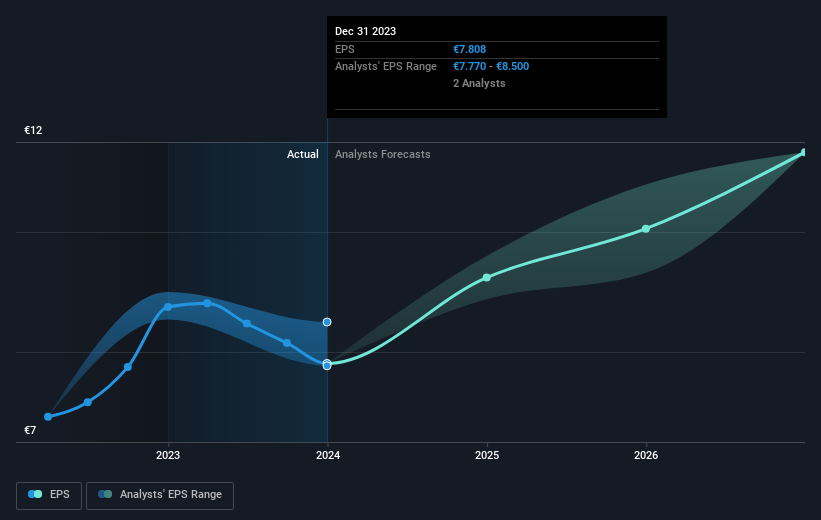
We know that Pfeiffer Vacuum Technology has improved its bottom line over the last three years, but what does the future have in store? If you are thinking of buying or selling Pfeiffer Vacuum Technology stock, you should check out this FREE detailed report on its balance sheet.
What About The Total Shareholder Return (TSR)?
Investors should note that there's a difference between Pfeiffer Vacuum Technology's total shareholder return (TSR) and its share price change, which we've covered above. The TSR is a return calculation that accounts for the value of cash dividends (assuming that any dividend received was reinvested) and the calculated value of any discounted capital raisings and spin-offs. Pfeiffer Vacuum Technology's TSR of 33% for the 5 years exceeded its share price return, because it has paid dividends.
A Different Perspective
It's nice to see that Pfeiffer Vacuum Technology shareholders have received a total shareholder return of 6.8% over the last year. That's better than the annualised return of 6% over half a decade, implying that the company is doing better recently. Given the share price momentum remains strong, it might be worth taking a closer look at the stock, lest you miss an opportunity. Before deciding if you like the current share price, check how Pfeiffer Vacuum Technology scores on these 3 valuation metrics.
But note: Pfeiffer Vacuum Technology may not be the best stock to buy. So take a peek at this free list of interesting companies with past earnings growth (and further growth forecast).
Please note, the market returns quoted in this article reflect the market weighted average returns of stocks that currently trade on German exchanges.
Have feedback on this article? Concerned about the content? Get in touch with us directly. Alternatively, email editorial-team (at) simplywallst.com.
This article by Simply Wall St is general in nature. We provide commentary based on historical data and analyst forecasts only using an unbiased methodology and our articles are not intended to be financial advice. It does not constitute a recommendation to buy or sell any stock, and does not take account of your objectives, or your financial situation. We aim to bring you long-term focused analysis driven by fundamental data. Note that our analysis may not factor in the latest price-sensitive company announcements or qualitative material. Simply Wall St has no position in any stocks mentioned.
