
 Yahoo Finance
 Those who invested in Steel Dynamics (NASDAQ:STLD) five years ago are up 476%
We think all investors should try to buy and hold high quality multi-year winners. And we've seen some truly amazing gains over the years. For example, the Steel Dynamics, Inc. (NASDAQ:STLD) share price is up a whopping 414% in the last half decade, a handsome return for long term holders. This just goes to show the value creation that some businesses can achieve.
So let's assess the underlying fundamentals over the last 5 years and see if they've moved in lock-step with shareholder returns.
View our latest analysis for Steel Dynamics
While markets are a powerful pricing mechanism, share prices reflect investor sentiment, not just underlying business performance. One way to examine how market sentiment has changed over time is to look at the interaction between a company's share price and its earnings per share (EPS).
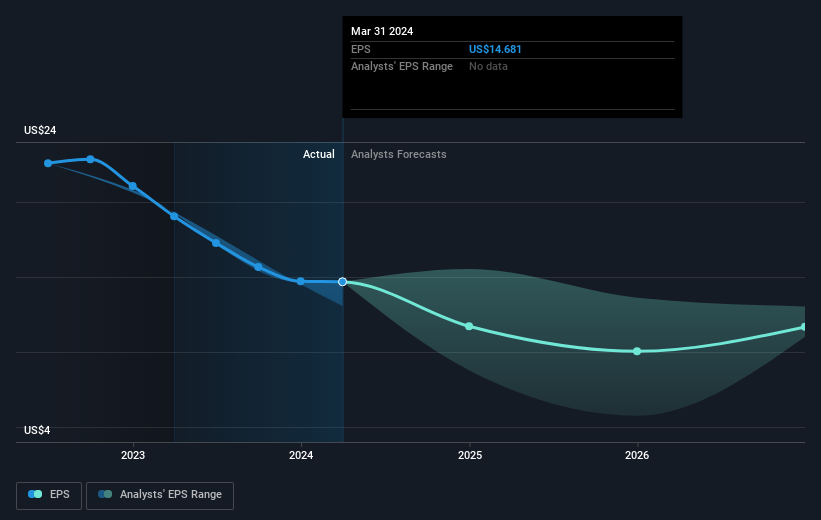
Over half a decade, Steel Dynamics managed to grow its earnings per share at 23% a year. This EPS growth is lower than the 39% average annual increase in the share price. This suggests that market participants hold the company in higher regard, these days. And that's hardly shocking given the track record of growth.
The company's earnings per share (over time) is depicted in the image below (click to see the exact numbers).
It is of course excellent to see how Steel Dynamics has grown profits over the years, but the future is more important for shareholders. This free interactive report on Steel Dynamics' balance sheet strength is a great place to start, if you want to investigate the stock further.
What About Dividends?
When looking at investment returns, it is important to consider the difference between total shareholder return (TSR) and share price return. The TSR incorporates the value of any spin-offs or discounted capital raisings, along with any dividends, based on the assumption that the dividends are reinvested. Arguably, the TSR gives a more comprehensive picture of the return generated by a stock. We note that for Steel Dynamics the TSR over the last 5 years was 476%, which is better than the share price return mentioned above. The dividends paid by the company have thusly boosted the total shareholder return.
A Different Perspective
It's nice to see that Steel Dynamics shareholders have received a total shareholder return of 39% over the last year. That's including the dividend. However, the TSR over five years, coming in at 42% per year, is even more impressive. I find it very interesting to look at share price over the long term as a proxy for business performance. But to truly gain insight, we need to consider other information, too. Even so, be aware that Steel Dynamics is showing 2 warning signs in our investment analysis , and 1 of those is significant...
Of course Steel Dynamics may not be the best stock to buy. So you may wish to see this free collection of growth stocks.
Please note, the market returns quoted in this article reflect the market weighted average returns of stocks that currently trade on American exchanges.
Have feedback on this article? Concerned about the content? Get in touch with us directly. Alternatively, email editorial-team (at) simplywallst.com.
This article by Simply Wall St is general in nature. We provide commentary based on historical data and analyst forecasts only using an unbiased methodology and our articles are not intended to be financial advice. It does not constitute a recommendation to buy or sell any stock, and does not take account of your objectives, or your financial situation. We aim to bring you long-term focused analysis driven by fundamental data. Note that our analysis may not factor in the latest price-sensitive company announcements or qualitative material. Simply Wall St has no position in any stocks mentioned.
