
 Yahoo Finance
 Titon Holdings' (LON:TON) Returns On Capital Tell Us There Is Reason To Feel Uneasy
Ignoring the stock price of a company, what are the underlying trends that tell us a business is past the growth phase? Typically, we'll see the trend of both return on capital employed (ROCE) declining and this usually coincides with a decreasing amount of capital employed. This indicates the company is producing less profit from its investments and its total assets are decreasing. So after glancing at the trends within Titon Holdings (LON:TON), we weren't too hopeful.
What is Return On Capital Employed (ROCE)?
For those who don't know, ROCE is a measure of a company's yearly pre-tax profit (its return), relative to the capital employed in the business. The formula for this calculation on Titon Holdings is:
Return on Capital Employed = Earnings Before Interest and Tax (EBIT) ÷ (Total Assets - Current Liabilities)
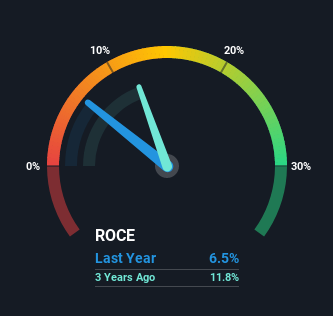
0.065 = UK£1.1m ÷ (UK£22m - UK£4.7m) (Based on the trailing twelve months to September 2021).
Thus, Titon Holdings has an ROCE of 6.5%. Ultimately, that's a low return and it under-performs the Building industry average of 13%.
View our latest analysis for Titon Holdings
While the past is not representative of the future, it can be helpful to know how a company has performed historically, which is why we have this chart above. If you want to delve into the historical earnings, revenue and cash flow of Titon Holdings, check out these free graphs here.
The Trend Of ROCE
In terms of Titon Holdings' historical ROCE movements, the trend doesn't inspire confidence. About five years ago, returns on capital were 12%, however they're now substantially lower than that as we saw above. On top of that, it's worth noting that the amount of capital employed within the business has remained relatively steady. Companies that exhibit these attributes tend to not be shrinking, but they can be mature and facing pressure on their margins from competition. So because these trends aren't typically conducive to creating a multi-bagger, we wouldn't hold our breath on Titon Holdings becoming one if things continue as they have.
Our Take On Titon Holdings' ROCE
All in all, the lower returns from the same amount of capital employed aren't exactly signs of a compounding machine. And long term shareholders have watched their investments stay flat over the last five years. That being the case, unless the underlying trends revert to a more positive trajectory, we'd consider looking elsewhere.
Titon Holdings does come with some risks though, we found 3 warning signs in our investment analysis, and 1 of those is a bit concerning...
While Titon Holdings isn't earning the highest return, check out this free list of companies that are earning high returns on equity with solid balance sheets.
Have feedback on this article? Concerned about the content? Get in touch with us directly. Alternatively, email editorial-team (at) simplywallst.com.
This article by Simply Wall St is general in nature. We provide commentary based on historical data and analyst forecasts only using an unbiased methodology and our articles are not intended to be financial advice. It does not constitute a recommendation to buy or sell any stock, and does not take account of your objectives, or your financial situation. We aim to bring you long-term focused analysis driven by fundamental data. Note that our analysis may not factor in the latest price-sensitive company announcements or qualitative material. Simply Wall St has no position in any stocks mentioned.
