
 Yahoo Finance
 The total return for Alliant Energy (NASDAQ:LNT) investors has risen faster than earnings growth over the last five years
When you buy and hold a stock for the long term, you definitely want it to provide a positive return. Furthermore, you'd generally like to see the share price rise faster than the market. Unfortunately for shareholders, while the Alliant Energy Corporation (NASDAQ:LNT) share price is up 26% in the last five years, that's less than the market return. Zooming in, the stock is actually down 17% in the last year.
While this past week has detracted from the company's five-year return, let's look at the recent trends of the underlying business and see if the gains have been in alignment.
Check out our latest analysis for Alliant Energy
There is no denying that markets are sometimes efficient, but prices do not always reflect underlying business performance. One imperfect but simple way to consider how the market perception of a company has shifted is to compare the change in the earnings per share (EPS) with the share price movement.
During five years of share price growth, Alliant Energy achieved compound earnings per share (EPS) growth of 6.6% per year. The EPS growth is more impressive than the yearly share price gain of 5% over the same period. Therefore, it seems the market has become relatively pessimistic about the company.
The company's earnings per share (over time) is depicted in the image below (click to see the exact numbers).
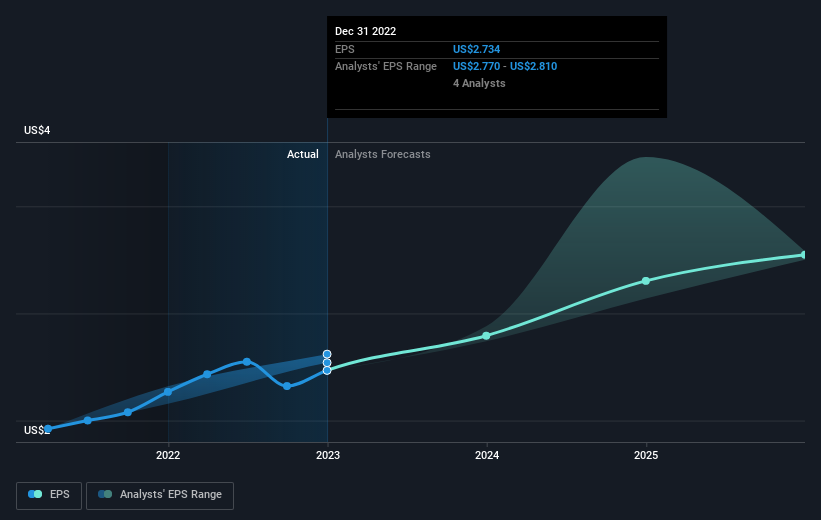
This free interactive report on Alliant Energy's earnings, revenue and cash flow is a great place to start, if you want to investigate the stock further.
What About Dividends?
When looking at investment returns, it is important to consider the difference between total shareholder return (TSR) and share price return. The TSR is a return calculation that accounts for the value of cash dividends (assuming that any dividend received was reinvested) and the calculated value of any discounted capital raisings and spin-offs. So for companies that pay a generous dividend, the TSR is often a lot higher than the share price return. As it happens, Alliant Energy's TSR for the last 5 years was 46%, which exceeds the share price return mentioned earlier. This is largely a result of its dividend payments!
A Different Perspective
Alliant Energy shareholders are down 15% over twelve months (even including dividends), which isn't far from the market return of -14%. The silver lining is that longer term investors would have made a total return of 8% per year over half a decade. If the fundamental data remains strong, and the share price is simply down on sentiment, then this could be an opportunity worth investigating. While it is well worth considering the different impacts that market conditions can have on the share price, there are other factors that are even more important. For instance, we've identified 2 warning signs for Alliant Energy (1 is potentially serious) that you should be aware of.
But note: Alliant Energy may not be the best stock to buy. So take a peek at this free list of interesting companies with past earnings growth (and further growth forecast).
Please note, the market returns quoted in this article reflect the market weighted average returns of stocks that currently trade on American exchanges.
Have feedback on this article? Concerned about the content? Get in touch with us directly. Alternatively, email editorial-team (at) simplywallst.com.
This article by Simply Wall St is general in nature. We provide commentary based on historical data and analyst forecasts only using an unbiased methodology and our articles are not intended to be financial advice. It does not constitute a recommendation to buy or sell any stock, and does not take account of your objectives, or your financial situation. We aim to bring you long-term focused analysis driven by fundamental data. Note that our analysis may not factor in the latest price-sensitive company announcements or qualitative material. Simply Wall St has no position in any stocks mentioned.
Join A Paid User Research Session
You’ll receive a US$30 Amazon Gift card for 1 hour of your time while helping us build better investing tools for the individual investors like yourself. Sign up here
