
 Yahoo Finance
 Tradegate Wertpapierhandelsbank's (FRA:T2G) investors will be pleased with their enviable 388% return over the last five years
Buying shares in the best businesses can build meaningful wealth for you and your family. While the best companies are hard to find, but they can generate massive returns over long periods. To wit, the Tradegate AG Wertpapierhandelsbank (FRA:T2G) share price has soared 335% over five years. And this is just one example of the epic gains achieved by some long term investors.
So let's investigate and see if the longer term performance of the company has been in line with the underlying business' progress.
View our latest analysis for Tradegate Wertpapierhandelsbank
In his essay The Superinvestors of Graham-and-Doddsville Warren Buffett described how share prices do not always rationally reflect the value of a business. One flawed but reasonable way to assess how sentiment around a company has changed is to compare the earnings per share (EPS) with the share price.
Over half a decade, Tradegate Wertpapierhandelsbank managed to grow its earnings per share at 2.6% a year. This EPS growth is slower than the share price growth of 34% per year, over the same period. This suggests that market participants hold the company in higher regard, these days. And that's hardly shocking given the track record of growth. This favorable sentiment is reflected in its (fairly optimistic) P/E ratio of 112.34.
You can see below how EPS has changed over time (discover the exact values by clicking on the image).
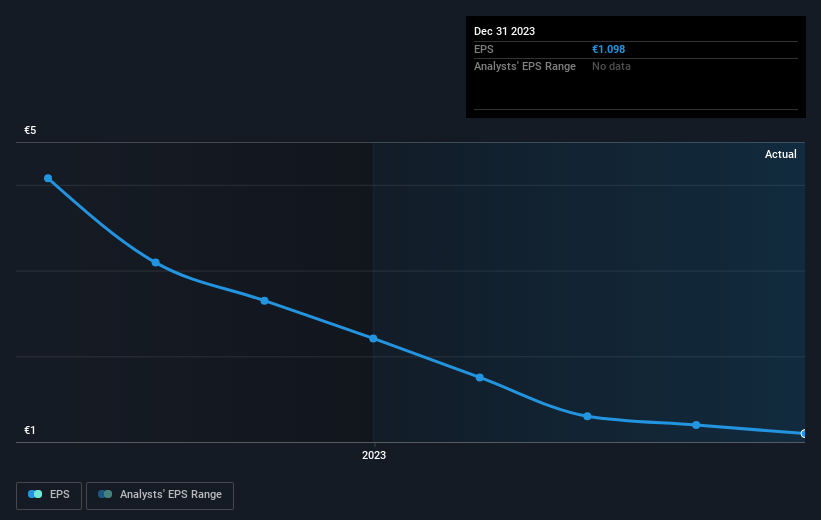
This free interactive report on Tradegate Wertpapierhandelsbank's earnings, revenue and cash flow is a great place to start, if you want to investigate the stock further.
What About Dividends?
When looking at investment returns, it is important to consider the difference between total shareholder return (TSR) and share price return. The TSR incorporates the value of any spin-offs or discounted capital raisings, along with any dividends, based on the assumption that the dividends are reinvested. So for companies that pay a generous dividend, the TSR is often a lot higher than the share price return. In the case of Tradegate Wertpapierhandelsbank, it has a TSR of 388% for the last 5 years. That exceeds its share price return that we previously mentioned. This is largely a result of its dividend payments!
A Different Perspective
Tradegate Wertpapierhandelsbank provided a TSR of 0.7% over the last twelve months. But that was short of the market average. On the bright side, the longer term returns (running at about 37% a year, over half a decade) look better. Maybe the share price is just taking a breather while the business executes on its growth strategy. You might want to assess this data-rich visualization of its earnings, revenue and cash flow.
If you are like me, then you will not want to miss this free list of growing companies that insiders are buying.
Please note, the market returns quoted in this article reflect the market weighted average returns of stocks that currently trade on German exchanges.
Have feedback on this article? Concerned about the content? Get in touch with us directly. Alternatively, email editorial-team (at) simplywallst.com.
This article by Simply Wall St is general in nature. We provide commentary based on historical data and analyst forecasts only using an unbiased methodology and our articles are not intended to be financial advice. It does not constitute a recommendation to buy or sell any stock, and does not take account of your objectives, or your financial situation. We aim to bring you long-term focused analysis driven by fundamental data. Note that our analysis may not factor in the latest price-sensitive company announcements or qualitative material. Simply Wall St has no position in any stocks mentioned.
