
 Yahoo Finance
 What Transocean Holdings Bhd.'s (KLSE:TOCEAN) P/E Is Not Telling You
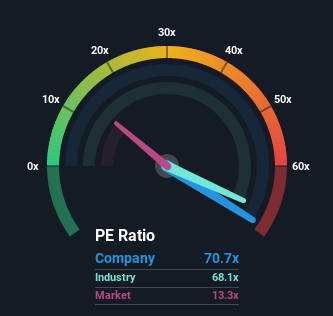
With a price-to-earnings (or "P/E") ratio of 70.7x Transocean Holdings Bhd. (KLSE:TOCEAN) may be sending very bearish signals at the moment, given that almost half of all companies in Malaysia have P/E ratios under 13x and even P/E's lower than 8x are not unusual. Although, it's not wise to just take the P/E at face value as there may be an explanation why it's so lofty.
For example, consider that Transocean Holdings Bhd's financial performance has been poor lately as it's earnings have been in decline. It might be that many expect the company to still outplay most other companies over the coming period, which has kept the P/E from collapsing. If not, then existing shareholders may be quite nervous about the viability of the share price.
See our latest analysis for Transocean Holdings Bhd
We don't have analyst forecasts, but you can see how recent trends are setting up the company for the future by checking out our free report on Transocean Holdings Bhd's earnings, revenue and cash flow.
How Is Transocean Holdings Bhd's Growth Trending?
Transocean Holdings Bhd's P/E ratio would be typical for a company that's expected to deliver very strong growth, and importantly, perform much better than the market.
Retrospectively, the last year delivered a frustrating 5.2% decrease to the company's bottom line. Unfortunately, that's brought it right back to where it started three years ago with EPS growth being virtually non-existent overall during that time. Therefore, it's fair to say that earnings growth has been inconsistent recently for the company.
This is in contrast to the rest of the market, which is expected to grow by 12% over the next year, materially higher than the company's recent medium-term annualised growth rates.
In light of this, it's alarming that Transocean Holdings Bhd's P/E sits above the majority of other companies. It seems most investors are ignoring the fairly limited recent growth rates and are hoping for a turnaround in the company's business prospects. Only the boldest would assume these prices are sustainable as a continuation of recent earnings trends is likely to weigh heavily on the share price eventually.
The Final Word
Using the price-to-earnings ratio alone to determine if you should sell your stock isn't sensible, however it can be a practical guide to the company's future prospects.
Our examination of Transocean Holdings Bhd revealed its three-year earnings trends aren't impacting its high P/E anywhere near as much as we would have predicted, given they look worse than current market expectations. When we see weak earnings with slower than market growth, we suspect the share price is at risk of declining, sending the high P/E lower. If recent medium-term earnings trends continue, it will place shareholders' investments at significant risk and potential investors in danger of paying an excessive premium.
And what about other risks? Every company has them, and we've spotted 1 warning sign for Transocean Holdings Bhd you should know about.
You might be able to find a better investment than Transocean Holdings Bhd. If you want a selection of possible candidates, check out this free list of interesting companies that trade on a P/E below 20x (but have proven they can grow earnings).
Have feedback on this article? Concerned about the content? Get in touch with us directly. Alternatively, email editorial-team (at) simplywallst.com.
This article by Simply Wall St is general in nature. We provide commentary based on historical data and analyst forecasts only using an unbiased methodology and our articles are not intended to be financial advice. It does not constitute a recommendation to buy or sell any stock, and does not take account of your objectives, or your financial situation. We aim to bring you long-term focused analysis driven by fundamental data. Note that our analysis may not factor in the latest price-sensitive company announcements or qualitative material. Simply Wall St has no position in any stocks mentioned.
Join A Paid User Research Session
You’ll receive a US$30 Amazon Gift card for 1 hour of your time while helping us build better investing tools for the individual investors like yourself. Sign up here
