
 Yahoo Finance
 The Trend Of High Returns At AO World (LON:AO.) Has Us Very Interested
Did you know there are some financial metrics that can provide clues of a potential multi-bagger? Amongst other things, we'll want to see two things; firstly, a growing return on capital employed (ROCE) and secondly, an expansion in the company's amount of capital employed. Basically this means that a company has profitable initiatives that it can continue to reinvest in, which is a trait of a compounding machine. With that in mind, the ROCE of AO World (LON:AO.) looks great, so lets see what the trend can tell us.
Understanding Return On Capital Employed (ROCE)
For those that aren't sure what ROCE is, it measures the amount of pre-tax profits a company can generate from the capital employed in its business. Analysts use this formula to calculate it for AO World:
Return on Capital Employed = Earnings Before Interest and Tax (EBIT) ÷ (Total Assets - Current Liabilities)
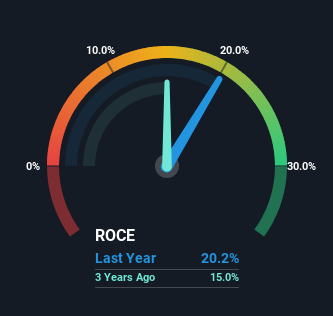
0.20 = UK£37m ÷ (UK£440m - UK£255m) (Based on the trailing twelve months to September 2023).
So, AO World has an ROCE of 20%. That's a fantastic return and not only that, it outpaces the average of 11% earned by companies in a similar industry.
View our latest analysis for AO World
Above you can see how the current ROCE for AO World compares to its prior returns on capital, but there's only so much you can tell from the past. If you're interested, you can view the analysts predictions in our free analyst report for AO World .
What Does the ROCE Trend For AO World Tell Us?
We're delighted to see that AO World is reaping rewards from its investments and is now generating some pre-tax profits. Shareholders would no doubt be pleased with this because the business was loss-making five years ago but is is now generating 20% on its capital. And unsurprisingly, like most companies trying to break into the black, AO World is utilizing 123% more capital than it was five years ago. This can indicate that there's plenty of opportunities to invest capital internally and at ever higher rates, both common traits of a multi-bagger.
Another thing to note, AO World has a high ratio of current liabilities to total assets of 58%. This can bring about some risks because the company is basically operating with a rather large reliance on its suppliers or other sorts of short-term creditors. While it's not necessarily a bad thing, it can be beneficial if this ratio is lower.
The Bottom Line
Long story short, we're delighted to see that AO World's reinvestment activities have paid off and the company is now profitable. Since the total return from the stock has been almost flat over the last five years, there might be an opportunity here if the valuation looks good. With that in mind, we believe the promising trends warrant this stock for further investigation.
While AO World looks impressive, no company is worth an infinite price. The intrinsic value infographic for AO. helps visualize whether it is currently trading for a fair price.
If you want to search for more stocks that have been earning high returns, check out this free list of stocks with solid balance sheets that are also earning high returns on equity.
Have feedback on this article? Concerned about the content? Get in touch with us directly. Alternatively, email editorial-team (at) simplywallst.com.
This article by Simply Wall St is general in nature. We provide commentary based on historical data and analyst forecasts only using an unbiased methodology and our articles are not intended to be financial advice. It does not constitute a recommendation to buy or sell any stock, and does not take account of your objectives, or your financial situation. We aim to bring you long-term focused analysis driven by fundamental data. Note that our analysis may not factor in the latest price-sensitive company announcements or qualitative material. Simply Wall St has no position in any stocks mentioned.
