
 Yahoo Finance
 What Type Of Shareholder Owns FW Thorpe Plc's (LON:TFW)?

A look at the shareholders of FW Thorpe Plc (LON:TFW) can tell us which group is most powerful. Large companies usually have institutions as shareholders, and we usually see insiders owning shares in smaller companies. I quite like to see at least a little bit of insider ownership. As Charlie Munger said 'Show me the incentive and I will show you the outcome.'
FW Thorpe is a smaller company with a market capitalization of UK£351m, so it may still be flying under the radar of many institutional investors. Our analysis of the ownership of the company, below, shows that institutions own shares in the company. Let's delve deeper into each type of owner, to discover more about TFW.
See our latest analysis for FW Thorpe
What Does The Institutional Ownership Tell Us About FW Thorpe?
Many institutions measure their performance against an index that approximates the local market. So they usually pay more attention to companies that are included in major indices.
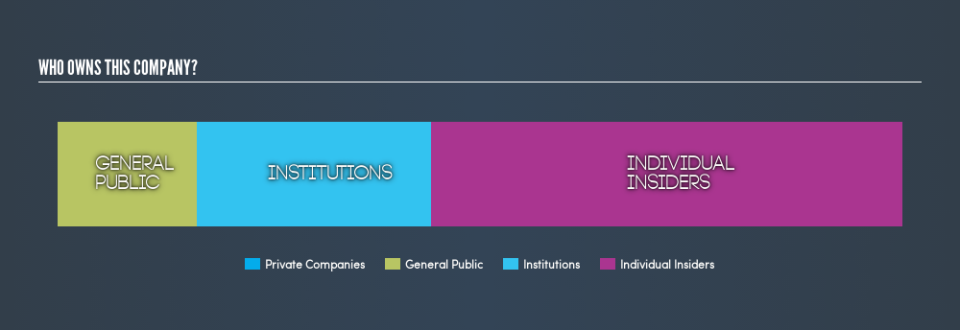
As you can see, institutional investors own 28% of FW Thorpe. This implies the analysts working for those institutions have looked at the stock and they like it. But just like anyone else, they could be wrong. It is not uncommon to see a big share price drop if two large institutional investors try to sell out of a stock at the same time. So it is worth checking the past earnings trajectory of FW Thorpe, (below). Of course, keep in mind that there are other factors to consider, too.

FW Thorpe is not owned by hedge funds. As far I can tell there isn't analyst coverage of the company, so it is probably flying under the radar.
Insider Ownership Of FW Thorpe
The definition of an insider can differ slightly between different countries, but members of the board of directors always count. The company management answer to the board; and the latter should represent the interests of shareholders. Notably, sometimes top-level managers are on the board, themselves.
Insider ownership is positive when it signals leadership are thinking like the true owners of the company. However, high insider ownership can also give immense power to a small group within the company. This can be negative in some circumstances.
Our information suggests that insiders own more than half of FW Thorpe Plc. This gives them effective control of the company. Given it has a market cap of UK£351m, that means they have UK£195m worth of shares. Most would argue this is a positive, showing strong alignment with shareholders. You can click here to see if those insiders have been buying or selling.
General Public Ownership
With a 16% ownership, the general public have some degree of sway over TFW. This size of ownership, while considerable, may not be enough to change company policy if the decision is not in sync with other large shareholders.
Next Steps:
While it is well worth considering the different groups that own a company, there are other factors that are even more important.
I like to dive deeper into how a company has performed in the past. You can find historic revenue and earnings in this detailed graph.
Of course, you might find a fantastic investment by looking elsewhere. So take a peek at this free list of interesting companies.
NB: Figures in this article are calculated using data from the last twelve months, which refer to the 12-month period ending on the last date of the month the financial statement is dated. This may not be consistent with full year annual report figures.
We aim to bring you long-term focused research analysis driven by fundamental data. Note that our analysis may not factor in the latest price-sensitive company announcements or qualitative material.
If you spot an error that warrants correction, please contact the editor at editorial-team@simplywallst.com. This article by Simply Wall St is general in nature. It does not constitute a recommendation to buy or sell any stock, and does not take account of your objectives, or your financial situation. Simply Wall St has no position in the stocks mentioned. Thank you for reading.
