
 Yahoo Finance
 U.S. Dollar Index (DX) Futures Technical Analysis – Buyers Facing Major Resistance at 90.950 to 91.370
The U.S. Dollar rose across the board to hit a four-week high against a basket of currencies on Friday. The move changed the main trend to up on the daily chart as data showing the COVID-19 pandemic’s continuing toll on the economy boosted demand for the safe-haven currency.
The dollar’s rebound from three-year lows, which began last week, may have some more room to run if the state of the economy worsens, but the currency’s longer-term outlook remained week.
On Friday, March U.S. Dollar Index futures settled at 90.754, up 0.539 or +0.60%.
Despite the recent rise in the dollar, speculators increased their net short dollar positions in the latest week, according to calculations by Reuters and U.S. Commodity Futures Trading Commission data released on Friday.
Daily Swing Chart Technical Analysis
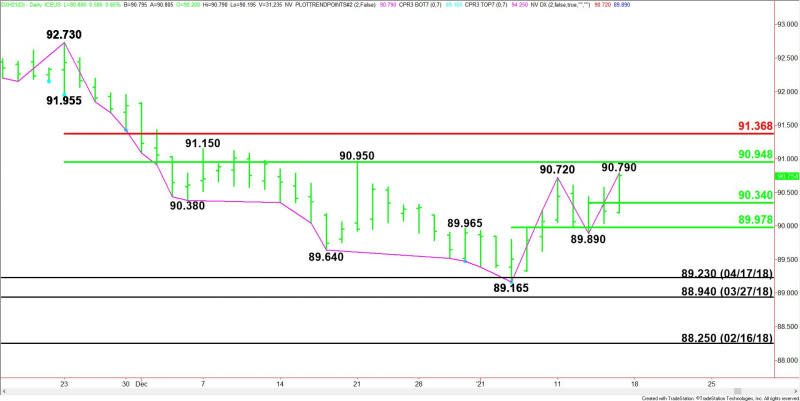
The main trend is up according to the daily swing chart. The trend turned up when buyers took out the previous main top at 90.720. A move through 89.890 will change the main trend to down.
On the downside, the minor support is a pair of 50% levels at 90.340 and 89.980.
The main range is 92.730 to 89.165. Its retracement zone at 90.950 to 91.370 is the primary upside target. Inside this zone are a pair of minor tops at 90.950 and 91.150, making them valid upside targets.
Short-Term Outlook
The near-term direction of the March U.S. Dollar Index will be determined by trader reaction to the main retracement zone at 90.950 to 91.370. The daily chart indicates there is plenty of room to the upside if 91.370 is taken out. If there is enough buying volume behind the breakout then look for an acceleration to the upside with 92.730 a potential upside target.
Dollar bulls will be encouraged over the near-term if investors continue to turn more risk-averse, dragging U.S. Treasury yields lower and trimming long stock positions.
We’ll also be looking for signs of real buying. At this time, it looks as if short-covering is still driving prices higher.
For a look at all of today’s economic events, check out our economic calendar.
This article was originally posted on FX Empire
