
 Yahoo Finance
 Under Armour (NYSE:UAA) Has A Rock Solid Balance Sheet

The external fund manager backed by Berkshire Hathaway's Charlie Munger, Li Lu, makes no bones about it when he says 'The biggest investment risk is not the volatility of prices, but whether you will suffer a permanent loss of capital.' It's only natural to consider a company's balance sheet when you examine how risky it is, since debt is often involved when a business collapses. We can see that Under Armour, Inc. (NYSE:UAA) does use debt in its business. But the real question is whether this debt is making the company risky.
When Is Debt A Problem?
Debt and other liabilities become risky for a business when it cannot easily fulfill those obligations, either with free cash flow or by raising capital at an attractive price. Ultimately, if the company can't fulfill its legal obligations to repay debt, shareholders could walk away with nothing. However, a more common (but still painful) scenario is that it has to raise new equity capital at a low price, thus permanently diluting shareholders. By replacing dilution, though, debt can be an extremely good tool for businesses that need capital to invest in growth at high rates of return. The first step when considering a company's debt levels is to consider its cash and debt together.
Check out our latest analysis for Under Armour
How Much Debt Does Under Armour Carry?
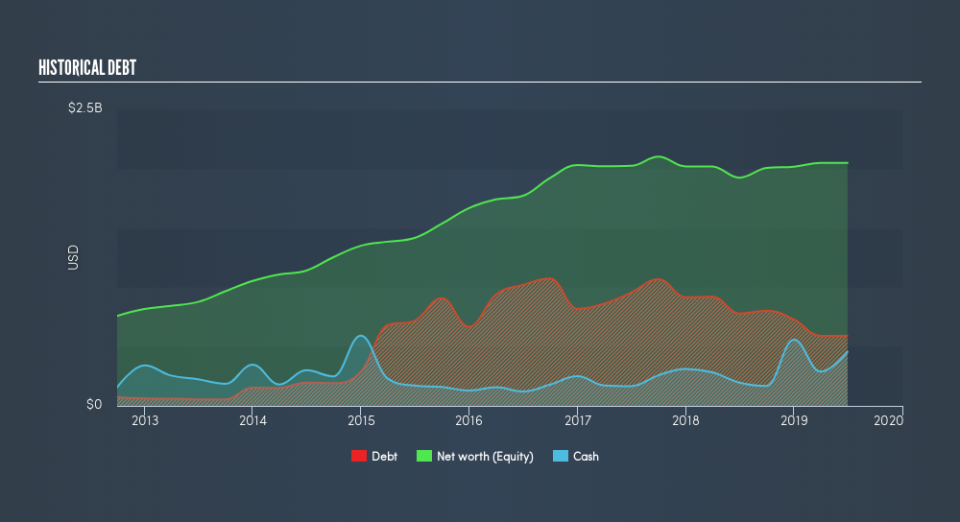
The image below, which you can click on for greater detail, shows that Under Armour had debt of US$591.4m at the end of June 2019, a reduction from US$779.4m over a year. However, it does have US$455.7m in cash offsetting this, leading to net debt of about US$135.7m.
How Strong Is Under Armour's Balance Sheet?
According to the last reported balance sheet, Under Armour had liabilities of US$1.33b due within 12 months, and liabilities of US$1.30b due beyond 12 months. On the other hand, it had cash of US$455.7m and US$740.4m worth of receivables due within a year. So it has liabilities totalling US$1.44b more than its cash and near-term receivables, combined.
Since publicly traded Under Armour shares are worth a total of US$8.03b, it seems unlikely that this level of liabilities would be a major threat. Having said that, it's clear that we should continue to monitor its balance sheet, lest it change for the worse.
In order to size up a company's debt relative to its earnings, we calculate its net debt divided by its earnings before interest, tax, depreciation, and amortization (EBITDA) and its earnings before interest and tax (EBIT) divided by its interest expense (its interest cover). Thus we consider debt relative to earnings both with and without depreciation and amortization expenses.
With net debt sitting at just 0.34 times EBITDA, Under Armour is arguably pretty conservatively geared. And this view is supported by the solid interest coverage, with EBIT coming in at 7.9 times the interest expense over the last year. In addition to that, we're happy to report that Under Armour has boosted its EBIT by 44%, thus reducing the spectre of future debt repayments. There's no doubt that we learn most about debt from the balance sheet. But it is future earnings, more than anything, that will determine Under Armour's ability to maintain a healthy balance sheet going forward. So if you're focused on the future you can check out this free report showing analyst profit forecasts.
Finally, a business needs free cash flow to pay off debt; accounting profits just don't cut it. So we always check how much of that EBIT is translated into free cash flow. Over the last three years, Under Armour actually produced more free cash flow than EBIT. That sort of strong cash conversion gets us as excited as the crowd when the beat drops at a Daft Punk concert.
Our View
Happily, Under Armour's impressive conversion of EBIT to free cash flow implies it has the upper hand on its debt. And that's just the beginning of the good news since its EBIT growth rate is also very heartening. Zooming out, Under Armour seems to use debt quite reasonably; and that gets the nod from us. While debt does bring risk, when used wisely it can also bring a higher return on equity. Above most other metrics, we think its important to track how fast earnings per share is growing, if at all. If you've also come to that realization, you're in luck, because today you can view this interactive graph of Under Armour's earnings per share history for free.
If, after all that, you're more interested in a fast growing company with a rock-solid balance sheet, then check out our list of net cash growth stocks without delay.
We aim to bring you long-term focused research analysis driven by fundamental data. Note that our analysis may not factor in the latest price-sensitive company announcements or qualitative material.
If you spot an error that warrants correction, please contact the editor at editorial-team@simplywallst.com. This article by Simply Wall St is general in nature. It does not constitute a recommendation to buy or sell any stock, and does not take account of your objectives, or your financial situation. Simply Wall St has no position in the stocks mentioned. Thank you for reading.
