
 Yahoo Finance
 We Like These Underlying Return On Capital Trends At CSP (NASDAQ:CSPI)
There are a few key trends to look for if we want to identify the next multi-bagger. Firstly, we'll want to see a proven return on capital employed (ROCE) that is increasing, and secondly, an expanding base of capital employed. Basically this means that a company has profitable initiatives that it can continue to reinvest in, which is a trait of a compounding machine. With that in mind, we've noticed some promising trends at CSP (NASDAQ:CSPI) so let's look a bit deeper.
What Is Return On Capital Employed (ROCE)?
If you haven't worked with ROCE before, it measures the 'return' (pre-tax profit) a company generates from capital employed in its business. Analysts use this formula to calculate it for CSP:
Return on Capital Employed = Earnings Before Interest and Tax (EBIT) ÷ (Total Assets - Current Liabilities)
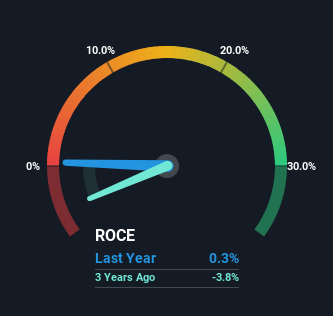
0.0032 = US$163k ÷ (US$67m - US$17m) (Based on the trailing twelve months to December 2023).
Therefore, CSP has an ROCE of 0.3%. Ultimately, that's a low return and it under-performs the IT industry average of 12%.
See our latest analysis for CSP
While the past is not representative of the future, it can be helpful to know how a company has performed historically, which is why we have this chart above. If you want to delve into the historical earnings , check out these free graphs detailing revenue and cash flow performance of CSP.
What The Trend Of ROCE Can Tell Us
CSP has recently broken into profitability so their prior investments seem to be paying off. The company was generating losses five years ago, but now it's earning 0.3% which is a sight for sore eyes. Not only that, but the company is utilizing 24% more capital than before, but that's to be expected from a company trying to break into profitability. We like this trend, because it tells us the company has profitable reinvestment opportunities available to it, and if it continues going forward that can lead to a multi-bagger performance.
What We Can Learn From CSP's ROCE
Overall, CSP gets a big tick from us thanks in most part to the fact that it is now profitable and is reinvesting in its business. And with the stock having performed exceptionally well over the last five years, these patterns are being accounted for by investors. With that being said, we still think the promising fundamentals mean the company deserves some further due diligence.
On a final note, we found 2 warning signs for CSP (1 is a bit concerning) you should be aware of.
While CSP isn't earning the highest return, check out this free list of companies that are earning high returns on equity with solid balance sheets.
Have feedback on this article? Concerned about the content? Get in touch with us directly. Alternatively, email editorial-team (at) simplywallst.com.
This article by Simply Wall St is general in nature. We provide commentary based on historical data and analyst forecasts only using an unbiased methodology and our articles are not intended to be financial advice. It does not constitute a recommendation to buy or sell any stock, and does not take account of your objectives, or your financial situation. We aim to bring you long-term focused analysis driven by fundamental data. Note that our analysis may not factor in the latest price-sensitive company announcements or qualitative material. Simply Wall St has no position in any stocks mentioned.
