
 Yahoo Finance
 We Like These Underlying Return On Capital Trends At Taseko Mines (TSE:TKO)
If we want to find a potential multi-bagger, often there are underlying trends that can provide clues. Firstly, we'd want to identify a growing return on capital employed (ROCE) and then alongside that, an ever-increasing base of capital employed. Put simply, these types of businesses are compounding machines, meaning they are continually reinvesting their earnings at ever-higher rates of return. With that in mind, we've noticed some promising trends at Taseko Mines (TSE:TKO) so let's look a bit deeper.
Return On Capital Employed (ROCE): What is it?
For those who don't know, ROCE is a measure of a company's yearly pre-tax profit (its return), relative to the capital employed in the business. To calculate this metric for Taseko Mines, this is the formula:
Return on Capital Employed = Earnings Before Interest and Tax (EBIT) ÷ (Total Assets - Current Liabilities)
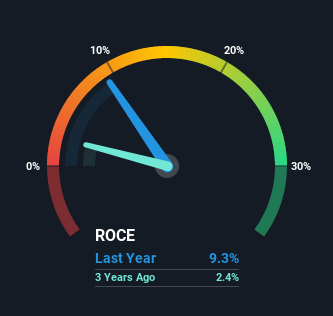
0.093 = CA$98m ÷ (CA$1.1b - CA$89m) (Based on the trailing twelve months to September 2021).
Thus, Taseko Mines has an ROCE of 9.3%. On its own that's a low return, but compared to the average of 4.2% generated by the Metals and Mining industry, it's much better.
View our latest analysis for Taseko Mines
In the above chart we have measured Taseko Mines' prior ROCE against its prior performance, but the future is arguably more important. If you'd like to see what analysts are forecasting going forward, you should check out our free report for Taseko Mines.
How Are Returns Trending?
We're delighted to see that Taseko Mines is reaping rewards from its investments and has now broken into profitability. The company was generating losses five years ago, but has managed to turn it around and as we saw earlier is now earning 9.3%, which is always encouraging. On top of that, what's interesting is that the amount of capital being employed has remained steady, so the business hasn't needed to put any additional money to work to generate these higher returns. That being said, while an increase in efficiency is no doubt appealing, it'd be helpful to know if the company does have any investment plans going forward. Because in the end, a business can only get so efficient.
In Conclusion...
To sum it up, Taseko Mines is collecting higher returns from the same amount of capital, and that's impressive. Since the stock has returned a staggering 205% to shareholders over the last five years, it looks like investors are recognizing these changes. In light of that, we think it's worth looking further into this stock because if Taseko Mines can keep these trends up, it could have a bright future ahead.
One more thing to note, we've identified 1 warning sign with Taseko Mines and understanding it should be part of your investment process.
If you want to search for solid companies with great earnings, check out this free list of companies with good balance sheets and impressive returns on equity.
This article by Simply Wall St is general in nature. We provide commentary based on historical data and analyst forecasts only using an unbiased methodology and our articles are not intended to be financial advice. It does not constitute a recommendation to buy or sell any stock, and does not take account of your objectives, or your financial situation. We aim to bring you long-term focused analysis driven by fundamental data. Note that our analysis may not factor in the latest price-sensitive company announcements or qualitative material. Simply Wall St has no position in any stocks mentioned.
Have feedback on this article? Concerned about the content? Get in touch with us directly. Alternatively, email editorial-team (at) simplywallst.com.
