
 Yahoo Finance
 We Like These Underlying Return On Capital Trends At Tootsie Roll Industries (NYSE:TR)
To find a multi-bagger stock, what are the underlying trends we should look for in a business? Ideally, a business will show two trends; firstly a growing return on capital employed (ROCE) and secondly, an increasing amount of capital employed. Put simply, these types of businesses are compounding machines, meaning they are continually reinvesting their earnings at ever-higher rates of return. With that in mind, we've noticed some promising trends at Tootsie Roll Industries (NYSE:TR) so let's look a bit deeper.
Understanding Return On Capital Employed (ROCE)
For those who don't know, ROCE is a measure of a company's yearly pre-tax profit (its return), relative to the capital employed in the business. To calculate this metric for Tootsie Roll Industries, this is the formula:
Return on Capital Employed = Earnings Before Interest and Tax (EBIT) ÷ (Total Assets - Current Liabilities)
0.10 = US$95m ÷ (US$1.0b - US$90m) (Based on the trailing twelve months to December 2022).
So, Tootsie Roll Industries has an ROCE of 10%. By itself that's a normal return on capital and it's in line with the industry's average returns of 10%.
See our latest analysis for Tootsie Roll Industries
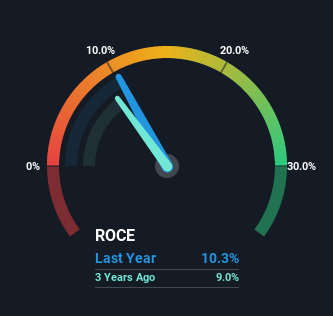
Historical performance is a great place to start when researching a stock so above you can see the gauge for Tootsie Roll Industries' ROCE against it's prior returns. If you want to delve into the historical earnings, revenue and cash flow of Tootsie Roll Industries, check out these free graphs here.
What The Trend Of ROCE Can Tell Us
Tootsie Roll Industries is showing promise given that its ROCE is trending up and to the right. Looking at the data, we can see that even though capital employed in the business has remained relatively flat, the ROCE generated has risen by 22% over the last five years. Basically the business is generating higher returns from the same amount of capital and that is proof that there are improvements in the company's efficiencies. It's worth looking deeper into this though because while it's great that the business is more efficient, it might also mean that going forward the areas to invest internally for the organic growth are lacking.
The Key Takeaway
As discussed above, Tootsie Roll Industries appears to be getting more proficient at generating returns since capital employed has remained flat but earnings (before interest and tax) are up. And with a respectable 82% awarded to those who held the stock over the last five years, you could argue that these developments are starting to get the attention they deserve. With that being said, we still think the promising fundamentals mean the company deserves some further due diligence.
Tootsie Roll Industries does have some risks though, and we've spotted 1 warning sign for Tootsie Roll Industries that you might be interested in.
While Tootsie Roll Industries isn't earning the highest return, check out this free list of companies that are earning high returns on equity with solid balance sheets.
Have feedback on this article? Concerned about the content? Get in touch with us directly. Alternatively, email editorial-team (at) simplywallst.com.
This article by Simply Wall St is general in nature. We provide commentary based on historical data and analyst forecasts only using an unbiased methodology and our articles are not intended to be financial advice. It does not constitute a recommendation to buy or sell any stock, and does not take account of your objectives, or your financial situation. We aim to bring you long-term focused analysis driven by fundamental data. Note that our analysis may not factor in the latest price-sensitive company announcements or qualitative material. Simply Wall St has no position in any stocks mentioned.
Join A Paid User Research Session
You’ll receive a US$30 Amazon Gift card for 1 hour of your time while helping us build better investing tools for the individual investors like yourself. Sign up here
