
 Yahoo Finance
 USD/CAD Daily Forecast – Bulls Resiliently Hovering Near Multi-Month Top
The Loonie pair rang the opening bell on Wednesday near 1.3281 level and displayed a slight bearish price action. Anyhow, the pair took a bounce off from the stable 1.3271 support handle, moving upside. At 03:00 GMT, the USD/CAD pair was making rounds near 1.3315 multiple month top mark with RSI indicating 60.37 levels.
Pressurized Crude Prices
The Crude Oil prices kept falling on Wednesday as intensifying US-Sino trade tensions mounted over the global economy. Therefore, the market fears of a substantial weakening in the overall demand outlook for the commodity.

Yesterday, the Oil prices had undergone a sharp pullback, breaking down out of a 2-month old symmetrical triangle. Such a breakdown signals for a bearish reversal pattern. Despite that, the Crude Oil WTI Future was 0.32% up since the last closing, trading near $53.57 bbl in the morning session. On moving further downside, the support handles stalled near $51.52 bbl and $50.63 bbl would get activated.
Significant Economic Events
The US economic docket remains quite silent today amid a lack of significant economic events. Anyhow, the Canadian July Ivey Purchasing Managers Index s.a. data release might attempt to tweak the pair’s daily movements. The market expects this Ivey Index to grow 1.15% over the previous 52.4 points.
Later the day, Oil-catalyst EIA Crude Oil Stocks Change computed since August 2 would come out at around 14:30 GMT. This time, the consensus estimate the Crude data to record -3.313 million over the last -8.496 million.
Technical Analysis
1-Day Chart
After maintaining a steady downtrend for the last two months, the USD/CAD pair made a reversal drift on July 19. From there, the pair had sustained some positive price actions, breaking and moving above 1.3148 resistance handle. Somehow, a healthy 1.3293 resistance mark stood at the entrance to the upside, capping pair’s daily gains today.
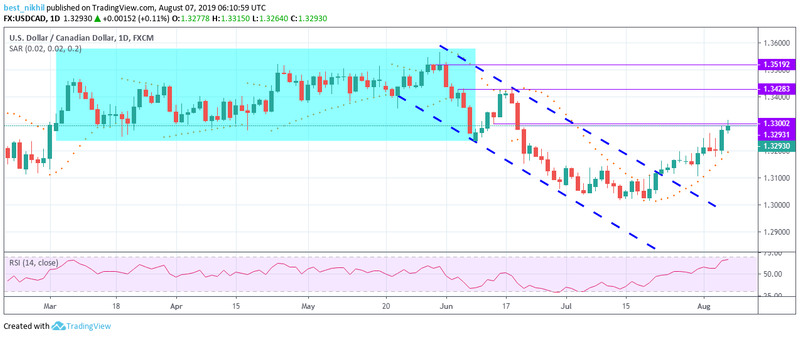
However, the bulls seem to possess enough strength, considering the below lying Parabolic SAR technical indicator. If the pair makes a triumphant march above this aforementioned resistance mark, then that would enable fresh challenge on next resistances stalled at 1.3300, 1.3428, and 1.3519 levels.
1-Hour Chart
On the hourly chart, the USD/CAD pair was resiliently moving upward, staying close to the 1:1 Gann line. Also, the histograms of the Moving Averages Convergence Divergence (MACD) were pointing to the north, encouraging the bulls.
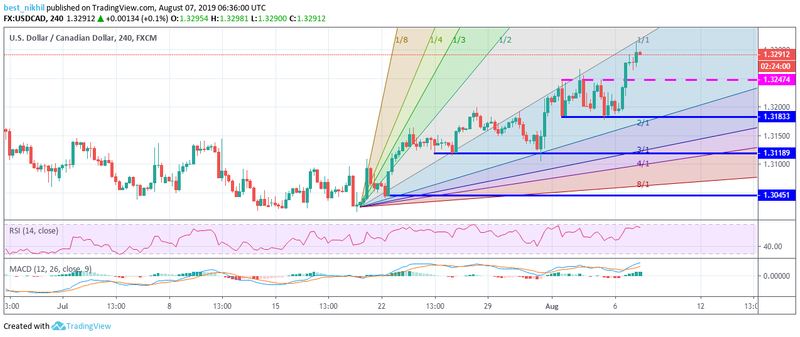
Nevertheless, if the pair takes an immediate downfall, then the 1.3247 resistance might turn into a firm support line, acting a strong barrier. However, in that case, any drastic drop beyond the 1.3247 mark would signal for further weakness in the pair, activating 1.3183, 1.3119, and 1.3045 support levels.
This article was originally posted on FX Empire
More From FXEMPIRE:
Natural Gas and Crude Oil – Diverging Setups for Technical Traders
Oil Price Fundamental Daily Forecast – EIA Report Expected to Show Small Draw
U.S. Dollar Index Futures (DX) Technical Analysis – August 7, 2019 Forecast
Natural Gas Price Fundamental Daily Forecast – Short-covering Rally Targets $2.181 to $2.217
