
 Yahoo Finance
 Warner Music Group Corp.'s (NASDAQ:WMG) Intrinsic Value Is Potentially 45% Above Its Share Price
Key Insights
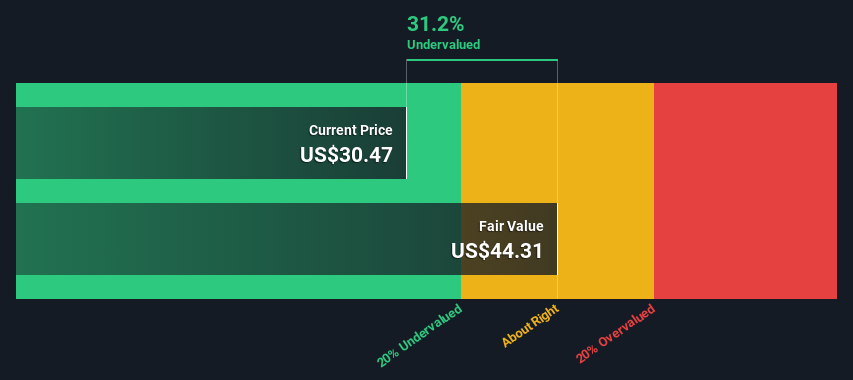
Warner Music Group's estimated fair value is US$44.31 based on 2 Stage Free Cash Flow to Equity
Warner Music Group is estimated to be 31% undervalued based on current share price of US$30.47
Analyst price target for WMG is US$38.13 which is 14% below our fair value estimate
Today we'll do a simple run through of a valuation method used to estimate the attractiveness of Warner Music Group Corp. (NASDAQ:WMG) as an investment opportunity by projecting its future cash flows and then discounting them to today's value. Our analysis will employ the Discounted Cash Flow (DCF) model. Believe it or not, it's not too difficult to follow, as you'll see from our example!
We generally believe that a company's value is the present value of all of the cash it will generate in the future. However, a DCF is just one valuation metric among many, and it is not without flaws. Anyone interested in learning a bit more about intrinsic value should have a read of the Simply Wall St analysis model.
See our latest analysis for Warner Music Group
Step By Step Through The Calculation
We use what is known as a 2-stage model, which simply means we have two different periods of growth rates for the company's cash flows. Generally the first stage is higher growth, and the second stage is a lower growth phase. To start off with, we need to estimate the next ten years of cash flows. Where possible we use analyst estimates, but when these aren't available we extrapolate the previous free cash flow (FCF) from the last estimate or reported value. We assume companies with shrinking free cash flow will slow their rate of shrinkage, and that companies with growing free cash flow will see their growth rate slow, over this period. We do this to reflect that growth tends to slow more in the early years than it does in later years.
Generally we assume that a dollar today is more valuable than a dollar in the future, and so the sum of these future cash flows is then discounted to today's value:
10-year free cash flow (FCF) forecast
2024 | 2025 | 2026 | 2027 | 2028 | 2029 | 2030 | 2031 | 2032 | 2033 | |
Levered FCF ($, Millions) | US$749.6m | US$830.5m | US$961.3m | US$1.00b | US$1.28b | US$1.41b | US$1.52b | US$1.61b | US$1.70b | US$1.77b |
Growth Rate Estimate Source | Analyst x7 | Analyst x8 | Analyst x7 | Analyst x3 | Analyst x1 | Est @ 10.24% | Est @ 7.88% | Est @ 6.23% | Est @ 5.07% | Est @ 4.27% |
Present Value ($, Millions) Discounted @ 8.0% | US$694 | US$712 | US$763 | US$738 | US$869 | US$887 | US$886 | US$871 | US$848 | US$818 |
("Est" = FCF growth rate estimated by Simply Wall St)
Present Value of 10-year Cash Flow (PVCF) = US$8.1b
After calculating the present value of future cash flows in the initial 10-year period, we need to calculate the Terminal Value, which accounts for all future cash flows beyond the first stage. For a number of reasons a very conservative growth rate is used that cannot exceed that of a country's GDP growth. In this case we have used the 5-year average of the 10-year government bond yield (2.4%) to estimate future growth. In the same way as with the 10-year 'growth' period, we discount future cash flows to today's value, using a cost of equity of 8.0%.
Terminal Value (TV)= FCF2033 × (1 + g) ÷ (r – g) = US$1.8b× (1 + 2.4%) ÷ (8.0%– 2.4%) = US$32b
Present Value of Terminal Value (PVTV)= TV / (1 + r)10= US$32b÷ ( 1 + 8.0%)10= US$15b
The total value is the sum of cash flows for the next ten years plus the discounted terminal value, which results in the Total Equity Value, which in this case is US$23b. In the final step we divide the equity value by the number of shares outstanding. Relative to the current share price of US$30.5, the company appears quite undervalued at a 31% discount to where the stock price trades currently. The assumptions in any calculation have a big impact on the valuation, so it is better to view this as a rough estimate, not precise down to the last cent.
The Assumptions
Now the most important inputs to a discounted cash flow are the discount rate, and of course, the actual cash flows. You don't have to agree with these inputs, I recommend redoing the calculations yourself and playing with them. The DCF also does not consider the possible cyclicality of an industry, or a company's future capital requirements, so it does not give a full picture of a company's potential performance. Given that we are looking at Warner Music Group as potential shareholders, the cost of equity is used as the discount rate, rather than the cost of capital (or weighted average cost of capital, WACC) which accounts for debt. In this calculation we've used 8.0%, which is based on a levered beta of 1.225. Beta is a measure of a stock's volatility, compared to the market as a whole. We get our beta from the industry average beta of globally comparable companies, with an imposed limit between 0.8 and 2.0, which is a reasonable range for a stable business.
SWOT Analysis for Warner Music Group
Strength
Debt is well covered by earnings.
Dividends are covered by earnings and cash flows.
Weakness
Earnings growth over the past year underperformed the Entertainment industry.
Dividend is low compared to the top 25% of dividend payers in the Entertainment market.
Opportunity
Annual earnings are forecast to grow faster than the American market.
Trading below our estimate of fair value by more than 20%.
Threat
Debt is not well covered by operating cash flow.
Annual revenue is forecast to grow slower than the American market.
Moving On:
Whilst important, the DCF calculation is only one of many factors that you need to assess for a company. The DCF model is not a perfect stock valuation tool. Preferably you'd apply different cases and assumptions and see how they would impact the company's valuation. For instance, if the terminal value growth rate is adjusted slightly, it can dramatically alter the overall result. Can we work out why the company is trading at a discount to intrinsic value? For Warner Music Group, we've compiled three pertinent aspects you should assess:
Risks: We feel that you should assess the 2 warning signs for Warner Music Group (1 is a bit concerning!) we've flagged before making an investment in the company.
Future Earnings: How does WMG's growth rate compare to its peers and the wider market? Dig deeper into the analyst consensus number for the upcoming years by interacting with our free analyst growth expectation chart.
Other Solid Businesses: Low debt, high returns on equity and good past performance are fundamental to a strong business. Why not explore our interactive list of stocks with solid business fundamentals to see if there are other companies you may not have considered!
PS. The Simply Wall St app conducts a discounted cash flow valuation for every stock on the NASDAQGS every day. If you want to find the calculation for other stocks just search here.
Have feedback on this article? Concerned about the content? Get in touch with us directly. Alternatively, email editorial-team (at) simplywallst.com.
This article by Simply Wall St is general in nature. We provide commentary based on historical data and analyst forecasts only using an unbiased methodology and our articles are not intended to be financial advice. It does not constitute a recommendation to buy or sell any stock, and does not take account of your objectives, or your financial situation. We aim to bring you long-term focused analysis driven by fundamental data. Note that our analysis may not factor in the latest price-sensitive company announcements or qualitative material. Simply Wall St has no position in any stocks mentioned.
Have feedback on this article? Concerned about the content? Get in touch with us directly. Alternatively, email editorial-team@simplywallst.com
