
 Yahoo Finance
 Should Weakness in Schneider National, Inc.'s (NYSE:SNDR) Stock Be Seen As A Sign That Market Will Correct The Share Price Given Decent Financials?
With its stock down 6.8% over the past three months, it is easy to disregard Schneider National (NYSE:SNDR). But if you pay close attention, you might find that its key financial indicators look quite decent, which could mean that the stock could potentially rise in the long-term given how markets usually reward more resilient long-term fundamentals. In this article, we decided to focus on Schneider National's ROE.
Return on equity or ROE is an important factor to be considered by a shareholder because it tells them how effectively their capital is being reinvested. In short, ROE shows the profit each dollar generates with respect to its shareholder investments.
See our latest analysis for Schneider National
How To Calculate Return On Equity?
The formula for ROE is:
Return on Equity = Net Profit (from continuing operations) ÷ Shareholders' Equity
So, based on the above formula, the ROE for Schneider National is:
5.4% = US$159m ÷ US$2.9b (Based on the trailing twelve months to March 2024).
The 'return' is the amount earned after tax over the last twelve months. One way to conceptualize this is that for each $1 of shareholders' capital it has, the company made $0.05 in profit.
What Is The Relationship Between ROE And Earnings Growth?
So far, we've learned that ROE is a measure of a company's profitability. Based on how much of its profits the company chooses to reinvest or "retain", we are then able to evaluate a company's future ability to generate profits. Generally speaking, other things being equal, firms with a high return on equity and profit retention, have a higher growth rate than firms that don’t share these attributes.
Schneider National's Earnings Growth And 5.4% ROE
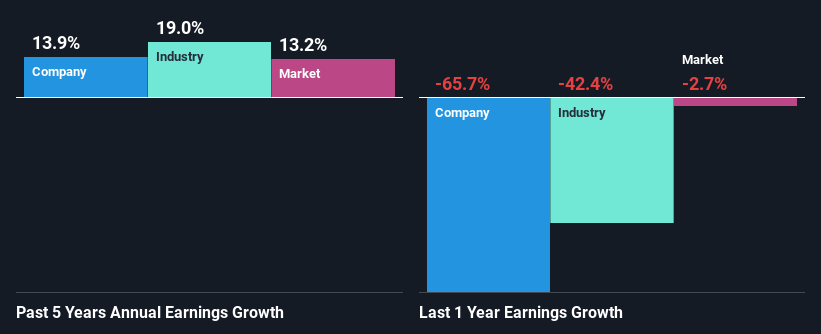
When you first look at it, Schneider National's ROE doesn't look that attractive. A quick further study shows that the company's ROE doesn't compare favorably to the industry average of 11% either. However, the moderate 14% net income growth seen by Schneider National over the past five years is definitely a positive. We reckon that there could be other factors at play here. Such as - high earnings retention or an efficient management in place.
We then compared Schneider National's net income growth with the industry and found that the company's growth figure is lower than the average industry growth rate of 19% in the same 5-year period, which is a bit concerning.
Earnings growth is a huge factor in stock valuation. It’s important for an investor to know whether the market has priced in the company's expected earnings growth (or decline). By doing so, they will have an idea if the stock is headed into clear blue waters or if swampy waters await. What is SNDR worth today? The intrinsic value infographic in our free research report helps visualize whether SNDR is currently mispriced by the market.
Is Schneider National Making Efficient Use Of Its Profits?
In Schneider National's case, its respectable earnings growth can probably be explained by its low three-year median payout ratio of 14% (or a retention ratio of 86%), which suggests that the company is investing most of its profits to grow its business.
Additionally, Schneider National has paid dividends over a period of seven years which means that the company is pretty serious about sharing its profits with shareholders. Looking at the current analyst consensus data, we can see that the company's future payout ratio is expected to rise to 24% over the next three years. However, Schneider National's future ROE is expected to rise to 9.1% despite the expected increase in the company's payout ratio. We infer that there could be other factors that could be driving the anticipated growth in the company's ROE.
Conclusion
On the whole, we do feel that Schneider National has some positive attributes. Specifically, its fairly high earnings growth number, which no doubt was backed by the company's high earnings retention. Still, the low ROE means that all that reinvestment is not reaping a lot of benefit to the investors. Having said that, looking at the current analyst estimates, we found that the company's earnings are expected to gain momentum. To know more about the latest analysts predictions for the company, check out this visualization of analyst forecasts for the company.
Have feedback on this article? Concerned about the content? Get in touch with us directly. Alternatively, email editorial-team (at) simplywallst.com.
This article by Simply Wall St is general in nature. We provide commentary based on historical data and analyst forecasts only using an unbiased methodology and our articles are not intended to be financial advice. It does not constitute a recommendation to buy or sell any stock, and does not take account of your objectives, or your financial situation. We aim to bring you long-term focused analysis driven by fundamental data. Note that our analysis may not factor in the latest price-sensitive company announcements or qualitative material. Simply Wall St has no position in any stocks mentioned.
