
 Yahoo Finance
 Will Weakness in SSE plc's (LON:SSE) Stock Prove Temporary Given Strong Fundamentals?
With its stock down 15% over the past month, it is easy to disregard SSE (LON:SSE). However, stock prices are usually driven by a company’s financial performance over the long term, which in this case looks quite promising. Particularly, we will be paying attention to SSE's ROE today.
Return on equity or ROE is a key measure used to assess how efficiently a company's management is utilizing the company's capital. In simpler terms, it measures the profitability of a company in relation to shareholder's equity.
See our latest analysis for SSE
How Is ROE Calculated?
The formula for ROE is:
Return on Equity = Net Profit (from continuing operations) ÷ Shareholders' Equity
So, based on the above formula, the ROE for SSE is:
28% = UK£2.6b ÷ UK£9.2b (Based on the trailing twelve months to March 2022).
The 'return' refers to a company's earnings over the last year. So, this means that for every £1 of its shareholder's investments, the company generates a profit of £0.28.
What Is The Relationship Between ROE And Earnings Growth?
So far, we've learned that ROE is a measure of a company's profitability. Based on how much of its profits the company chooses to reinvest or "retain", we are then able to evaluate a company's future ability to generate profits. Assuming all else is equal, companies that have both a higher return on equity and higher profit retention are usually the ones that have a higher growth rate when compared to companies that don't have the same features.
SSE's Earnings Growth And 28% ROE
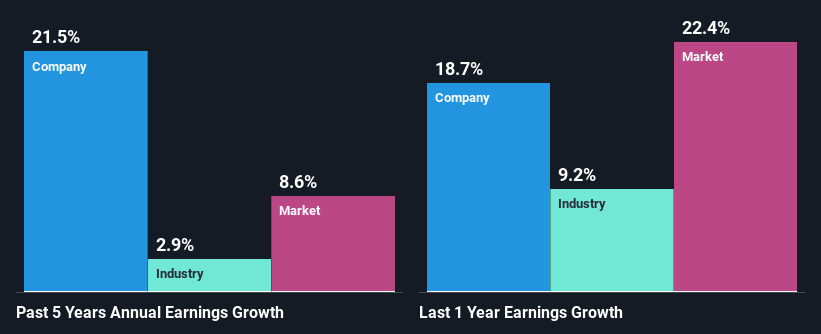
First thing first, we like that SSE has an impressive ROE. Secondly, even when compared to the industry average of 10.0% the company's ROE is quite impressive. As a result, SSE's exceptional 22% net income growth seen over the past five years, doesn't come as a surprise.
Next, on comparing with the industry net income growth, we found that SSE's growth is quite high when compared to the industry average growth of 6.3% in the same period, which is great to see.
The basis for attaching value to a company is, to a great extent, tied to its earnings growth. What investors need to determine next is if the expected earnings growth, or the lack of it, is already built into the share price. This then helps them determine if the stock is placed for a bright or bleak future. Is SSE fairly valued compared to other companies? These 3 valuation measures might help you decide.
Is SSE Using Its Retained Earnings Effectively?
The high three-year median payout ratio of 59% (implying that it keeps only 41% of profits) for SSE suggests that the company's growth wasn't really hampered despite it returning most of the earnings to its shareholders.
Additionally, SSE has paid dividends over a period of at least ten years which means that the company is pretty serious about sharing its profits with shareholders. Existing analyst estimates suggest that the company's future payout ratio is expected to drop to 43% over the next three years. Regardless, the future ROE for SSE is predicted to decline to 15% despite the anticipated decrease in the payout ratio. We reckon that there could probably be other factors that could be driving the forseen decline in the company's ROE.
Conclusion
In total, we are pretty happy with SSE's performance. We are particularly impressed by the considerable earnings growth posted by the company, which was likely backed by its high ROE. While the company is paying out most of its earnings as dividends, it has been able to grow its earnings in spite of it, so that's probably a good sign. Having said that, on studying current analyst estimates, we were concerned to see that while the company has grown its earnings in the past, analysts expect its earnings to shrink in the future. To know more about the latest analysts predictions for the company, check out this visualization of analyst forecasts for the company.
Have feedback on this article? Concerned about the content? Get in touch with us directly. Alternatively, email editorial-team (at) simplywallst.com.
This article by Simply Wall St is general in nature. We provide commentary based on historical data and analyst forecasts only using an unbiased methodology and our articles are not intended to be financial advice. It does not constitute a recommendation to buy or sell any stock, and does not take account of your objectives, or your financial situation. We aim to bring you long-term focused analysis driven by fundamental data. Note that our analysis may not factor in the latest price-sensitive company announcements or qualitative material. Simply Wall St has no position in any stocks mentioned.
Join A Paid User Research Session
You’ll receive a US$30 Amazon Gift card for 1 hour of your time while helping us build better investing tools for the individual investors like yourself. Sign up here
