
 Yahoo Finance
 Weg SA's Dividend Analysis
Assessing the Sustainability of Weg SA's Upcoming Dividend
Weg SA (WEGZY) recently announced a dividend of $0.01 per share, payable on 2024-08-21, with the ex-dividend date set for 2024-03-28. As investors look forward to this upcoming payment, the spotlight also shines on the company's dividend history, yield, and growth rates. Using the data from GuruFocus, let's look into Weg SA's dividend performance and assess its sustainability.
What Does Weg SA Do?
This Powerful Chart Made Peter Lynch 29% A Year For 13 Years
How to calculate the intrinsic value of a stock?
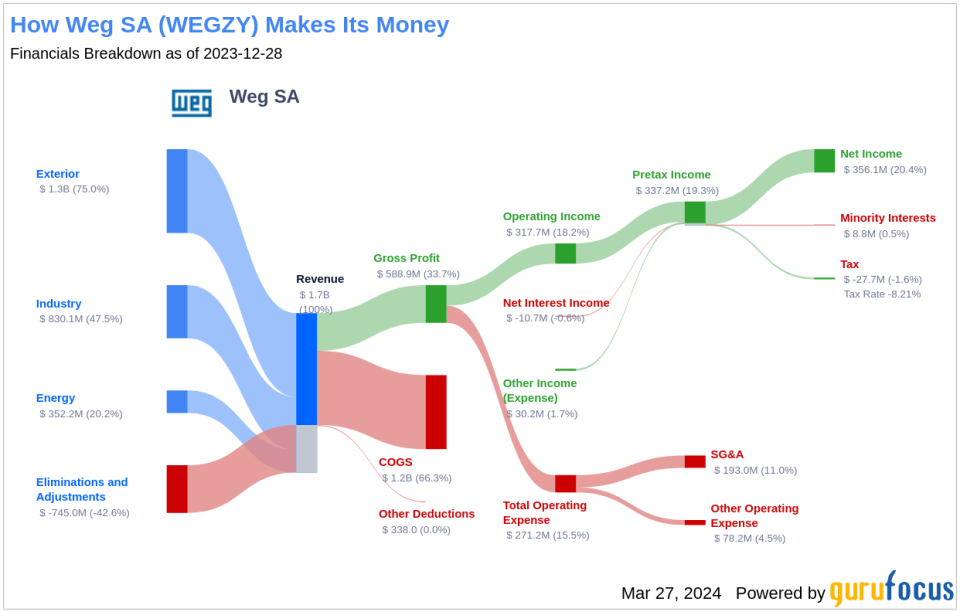
Weg SA produces and sells electric motors, generators, control systems, and other industrial devices worldwide. The company has three reportable segments: industry, energy, and foreign (outside of Brazil). The industry segment manufactures various motors, drives, controls, and equipment for industrial automation. Energy products primarily consist of electricity generators for power plants, turbines, control systems, and transformers to aid distributed energy systems and solutions.
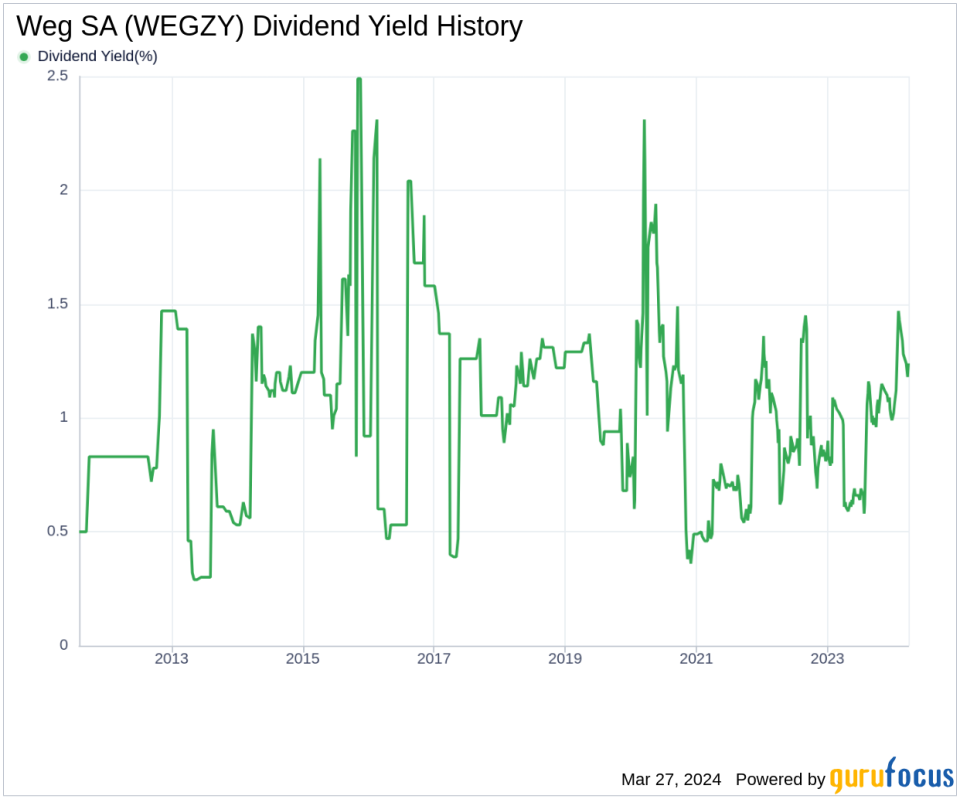
A Glimpse at Weg SA's Dividend History
Weg SA has maintained a consistent dividend payment record since 2010. Dividends are currently distributed on a quarterly basis. Below is a chart showing annual Dividends Per Share for tracking historical trends.
Breaking Down Weg SA's Dividend Yield and Growth
As of today, Weg SA currently has a 12-month trailing dividend yield of 1.52% and a 12-month forward dividend yield of 1.29%. This suggests an expectation of decreased dividend payments over the next 12 months.
Over the past three years, Weg SA's annual dividend growth rate was 66.60%. Extended to a five-year horizon, this rate decreased to 43.80% per year. And over the past decade, Weg SA's annual dividends per share growth rate stands at an impressive 20.40%.
Based on Weg SA's dividend yield and five-year growth rate, the 5-year yield on cost of Weg SA stock as of today is approximately 9.35%.
The Sustainability Question: Payout Ratio and Profitability
To assess the sustainability of the dividend, one needs to evaluate the company's payout ratio. The dividend payout ratio provides insights into the portion of earnings the company distributes as dividends. A lower ratio suggests that the company retains a significant part of its earnings, thereby ensuring the availability of funds for future growth and unexpected downturns. As of 2023-12-31, Weg SA's dividend payout ratio is 0.45.
Weg SA's profitability rank, offers an understanding of the company's earnings prowess relative to its peers. GuruFocus ranks Weg SA's profitability 9 out of 10 as of 2023-12-31, suggesting good profitability prospects. The company has reported positive net income for each year over the past decade, further solidifying its high profitability.
Growth Metrics: The Future Outlook
To ensure the sustainability of dividends, a company must have robust growth metrics. Weg SA's growth rank of 9 out of 10 suggests that the company's growth trajectory is strong relative to its competitors.
Revenue is the lifeblood of any company, and Weg SA's revenue per share, combined with the 3-year revenue growth rate, indicates a strong revenue model. Weg SA's revenue has increased by approximately 23.00% per year on average, a rate that outperforms approximately 84.39% of global competitors.
The company's 3-year EPS growth rate showcases its capability to grow its earnings, a critical component for sustaining dividends in the long run. During the past three years, Weg SA's earnings increased by approximately 31.90% per year on average, a rate that outperforms approximately 74.07% of global competitors.
Lastly, the company's 5-year EBITDA growth rate of 39.40%, which outperforms approximately 91.56% of global competitors, demonstrates Weg SA's efficiency and operational effectiveness.
Next Steps
In conclusion, Weg SA's upcoming dividend, backed by a history of consistent payments and a strong dividend growth rate, presents an attractive proposition for value investors. The company's low payout ratio coupled with high profitability and robust growth metrics suggest that the dividend is sustainable. Investors considering Weg SA as part of their portfolio for stable income should also take note of the company's solid financial health and growth prospects. For those seeking to explore further, GuruFocus Premium users can screen for high-dividend yield stocks using the High Dividend Yield Screener.
This article, generated by GuruFocus, is designed to provide general insights and is not tailored financial advice. Our commentary is rooted in historical data and analyst projections, utilizing an impartial methodology, and is not intended to serve as specific investment guidance. It does not formulate a recommendation to purchase or divest any stock and does not consider individual investment objectives or financial circumstances. Our objective is to deliver long-term, fundamental data-driven analysis. Be aware that our analysis might not incorporate the most recent, price-sensitive company announcements or qualitative information. GuruFocus holds no position in the stocks mentioned herein.
This article first appeared on GuruFocus.
