
 Yahoo Finance
 WestRock Company's (NYSE:WRK) Financials Are Too Obscure To Link With Current Share Price Momentum: What's In Store For the Stock?
Most readers would already be aware that WestRock's (NYSE:WRK) stock increased significantly by 21% over the past three months. However, we wonder if the company's inconsistent financials would have any adverse impact on the current share price momentum. In this article, we decided to focus on WestRock's ROE.
Return on equity or ROE is a key measure used to assess how efficiently a company's management is utilizing the company's capital. Put another way, it reveals the company's success at turning shareholder investments into profits.
View our latest analysis for WestRock
How Is ROE Calculated?
Return on equity can be calculated by using the formula:
Return on Equity = Net Profit (from continuing operations) ÷ Shareholders' Equity
So, based on the above formula, the ROE for WestRock is:
3.0% = US$308m ÷ US$10b (Based on the trailing twelve months to March 2024).
The 'return' is the amount earned after tax over the last twelve months. So, this means that for every $1 of its shareholder's investments, the company generates a profit of $0.03.
Why Is ROE Important For Earnings Growth?
Thus far, we have learned that ROE measures how efficiently a company is generating its profits. Depending on how much of these profits the company reinvests or "retains", and how effectively it does so, we are then able to assess a company’s earnings growth potential. Generally speaking, other things being equal, firms with a high return on equity and profit retention, have a higher growth rate than firms that don’t share these attributes.
WestRock's Earnings Growth And 3.0% ROE
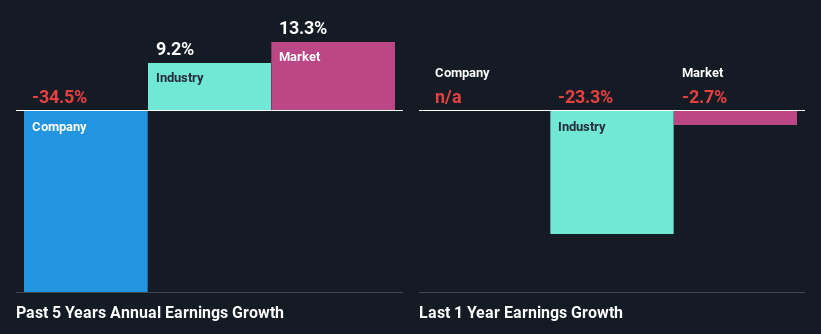
As you can see, WestRock's ROE looks pretty weak. Even compared to the average industry ROE of 16%, the company's ROE is quite dismal. For this reason, WestRock's five year net income decline of 34% is not surprising given its lower ROE. We believe that there also might be other aspects that are negatively influencing the company's earnings prospects. Such as - low earnings retention or poor allocation of capital.
However, when we compared WestRock's growth with the industry we found that while the company's earnings have been shrinking, the industry has seen an earnings growth of 9.2% in the same period. This is quite worrisome.
The basis for attaching value to a company is, to a great extent, tied to its earnings growth. What investors need to determine next is if the expected earnings growth, or the lack of it, is already built into the share price. This then helps them determine if the stock is placed for a bright or bleak future. If you're wondering about WestRock's's valuation, check out this gauge of its price-to-earnings ratio, as compared to its industry.
Is WestRock Efficiently Re-investing Its Profits?
Despite having a normal three-year median payout ratio of 27% (where it is retaining 73% of its profits), WestRock has seen a decline in earnings as we saw above. It looks like there might be some other reasons to explain the lack in that respect. For example, the business could be in decline.
Moreover, WestRock has been paying dividends for at least ten years or more suggesting that management must have perceived that the shareholders prefer dividends over earnings growth. Our latest analyst data shows that the future payout ratio of the company over the next three years is expected to be approximately 28%. Regardless, the future ROE for WestRock is predicted to rise to 9.5% despite there being not much change expected in its payout ratio.
Conclusion
In total, we're a bit ambivalent about WestRock's performance. Even though it appears to be retaining most of its profits, given the low ROE, investors may not be benefitting from all that reinvestment after all. The low earnings growth suggests our theory correct. Having said that, looking at current analyst estimates, we found that the company's earnings growth rate is expected to see a huge improvement. To know more about the latest analysts predictions for the company, check out this visualization of analyst forecasts for the company.
Have feedback on this article? Concerned about the content? Get in touch with us directly. Alternatively, email editorial-team (at) simplywallst.com.
This article by Simply Wall St is general in nature. We provide commentary based on historical data and analyst forecasts only using an unbiased methodology and our articles are not intended to be financial advice. It does not constitute a recommendation to buy or sell any stock, and does not take account of your objectives, or your financial situation. We aim to bring you long-term focused analysis driven by fundamental data. Note that our analysis may not factor in the latest price-sensitive company announcements or qualitative material. Simply Wall St has no position in any stocks mentioned.
