
 Yahoo Finance
 While shareholders of ABN AMRO Bank (AMS:ABN) are in the black over 3 years, those who bought a week ago aren't so fortunate
By buying an index fund, investors can approximate the average market return. But if you pick the right individual stocks, you could make more than that. For example, ABN AMRO Bank N.V. (AMS:ABN) shareholders have seen the share price rise 45% over three years, well in excess of the market return (12%, not including dividends). On the other hand, the returns haven't been quite so good recently, with shareholders up just 13% , including dividends .
While the stock has fallen 3.6% this week, it's worth focusing on the longer term and seeing if the stocks historical returns have been driven by the underlying fundamentals.
Check out our latest analysis for ABN AMRO Bank
There is no denying that markets are sometimes efficient, but prices do not always reflect underlying business performance. By comparing earnings per share (EPS) and share price changes over time, we can get a feel for how investor attitudes to a company have morphed over time.
During three years of share price growth, ABN AMRO Bank moved from a loss to profitability. That would generally be considered a positive, so we'd expect the share price to be up.
The graphic below depicts how EPS has changed over time (unveil the exact values by clicking on the image).
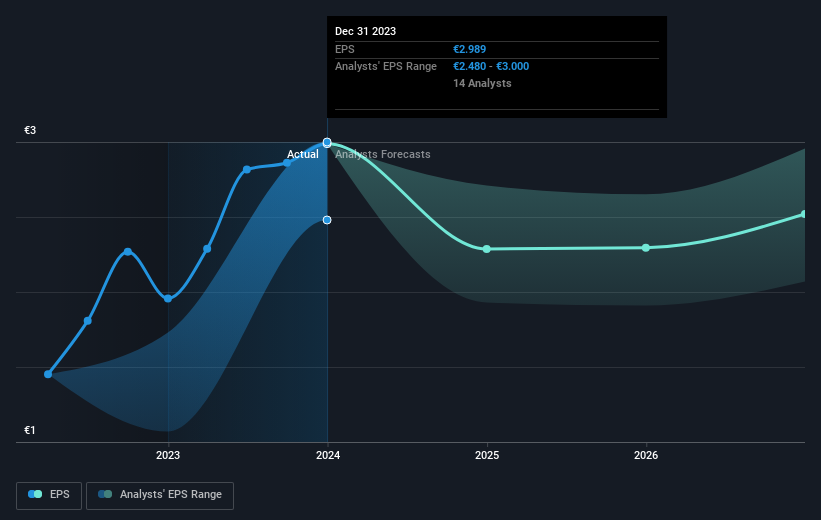
We're pleased to report that the CEO is remunerated more modestly than most CEOs at similarly capitalized companies. It's always worth keeping an eye on CEO pay, but a more important question is whether the company will grow earnings throughout the years. Before buying or selling a stock, we always recommend a close examination of historic growth trends, available here..
What About Dividends?
It is important to consider the total shareholder return, as well as the share price return, for any given stock. Whereas the share price return only reflects the change in the share price, the TSR includes the value of dividends (assuming they were reinvested) and the benefit of any discounted capital raising or spin-off. So for companies that pay a generous dividend, the TSR is often a lot higher than the share price return. As it happens, ABN AMRO Bank's TSR for the last 3 years was 81%, which exceeds the share price return mentioned earlier. This is largely a result of its dividend payments!
A Different Perspective
ABN AMRO Bank shareholders are up 13% for the year (even including dividends). But that was short of the market average. On the bright side, that's still a gain, and it is certainly better than the yearly loss of about 0.5% endured over half a decade. So this might be a sign the business has turned its fortunes around. It's always interesting to track share price performance over the longer term. But to understand ABN AMRO Bank better, we need to consider many other factors. Consider for instance, the ever-present spectre of investment risk. We've identified 2 warning signs with ABN AMRO Bank (at least 1 which is significant) , and understanding them should be part of your investment process.
Of course ABN AMRO Bank may not be the best stock to buy. So you may wish to see this free collection of growth stocks.
Please note, the market returns quoted in this article reflect the market weighted average returns of stocks that currently trade on Dutch exchanges.
Have feedback on this article? Concerned about the content? Get in touch with us directly. Alternatively, email editorial-team (at) simplywallst.com.
This article by Simply Wall St is general in nature. We provide commentary based on historical data and analyst forecasts only using an unbiased methodology and our articles are not intended to be financial advice. It does not constitute a recommendation to buy or sell any stock, and does not take account of your objectives, or your financial situation. We aim to bring you long-term focused analysis driven by fundamental data. Note that our analysis may not factor in the latest price-sensitive company announcements or qualitative material. Simply Wall St has no position in any stocks mentioned.
