
 Yahoo Finance
 While Silex Systems (ASX:SLX) shareholders have made 987% in 5 years, increasing losses might now be front of mind as stock sheds 6.4% this week
Silex Systems Limited (ASX:SLX) shareholders might be concerned after seeing the share price drop 17% in the last month. But that does not change the realty that the stock's performance has been terrific, over five years. Indeed, the share price is up a whopping 987% in that time. Arguably, the recent fall is to be expected after such a strong rise. But the real question is whether the business fundamentals can improve over the long term. Anyone who held for that rewarding ride would probably be keen to talk about it.
While this past week has detracted from the company's five-year return, let's look at the recent trends of the underlying business and see if the gains have been in alignment.
See our latest analysis for Silex Systems
Silex Systems isn't currently profitable, so most analysts would look to revenue growth to get an idea of how fast the underlying business is growing. Shareholders of unprofitable companies usually desire strong revenue growth. As you can imagine, fast revenue growth, when maintained, often leads to fast profit growth.
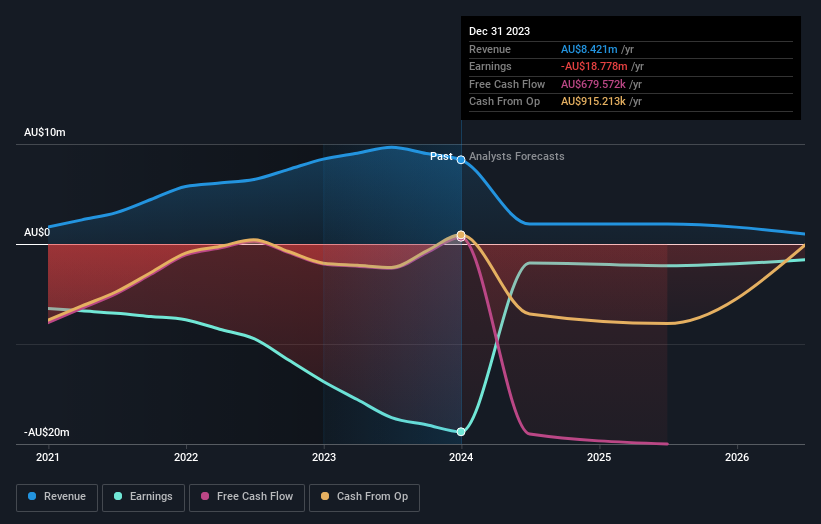
For the last half decade, Silex Systems can boast revenue growth at a rate of 44% per year. Even measured against other revenue-focussed companies, that's a good result. Arguably, this is well and truly reflected in the strong share price gain of 61%(per year) over the same period. It's never too late to start following a top notch stock like Silex Systems, since some long term winners go on winning for decades. On the face of it, this looks lke a good opportunity, although we note sentiment seems very positive already.
The image below shows how earnings and revenue have tracked over time (if you click on the image you can see greater detail).
Balance sheet strength is crucial. It might be well worthwhile taking a look at our free report on how its financial position has changed over time.
A Different Perspective
It's nice to see that Silex Systems shareholders have received a total shareholder return of 30% over the last year. Having said that, the five-year TSR of 61% a year, is even better. Potential buyers might understandably feel they've missed the opportunity, but it's always possible business is still firing on all cylinders. I find it very interesting to look at share price over the long term as a proxy for business performance. But to truly gain insight, we need to consider other information, too. To that end, you should be aware of the 1 warning sign we've spotted with Silex Systems .
But note: Silex Systems may not be the best stock to buy. So take a peek at this free list of interesting companies with past earnings growth (and further growth forecast).
Please note, the market returns quoted in this article reflect the market weighted average returns of stocks that currently trade on Australian exchanges.
Have feedback on this article? Concerned about the content? Get in touch with us directly. Alternatively, email editorial-team (at) simplywallst.com.
This article by Simply Wall St is general in nature. We provide commentary based on historical data and analyst forecasts only using an unbiased methodology and our articles are not intended to be financial advice. It does not constitute a recommendation to buy or sell any stock, and does not take account of your objectives, or your financial situation. We aim to bring you long-term focused analysis driven by fundamental data. Note that our analysis may not factor in the latest price-sensitive company announcements or qualitative material. Simply Wall St has no position in any stocks mentioned.
Have feedback on this article? Concerned about the content? Get in touch with us directly. Alternatively, email editorial-team@simplywallst.com
