
 Yahoo Finance
 Why Investors Shouldn't Be Surprised By Grainger plc's (LON:GRI) P/E

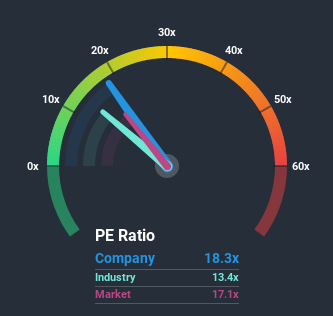
It's not a stretch to say that Grainger plc's (LON:GRI) price-to-earnings (or "P/E") ratio of 18.3x right now seems quite "middle-of-the-road" compared to the market in the United Kingdom, where the median P/E ratio is around 17x. Although, it's not wise to simply ignore the P/E without explanation as investors may be disregarding a distinct opportunity or a costly mistake.
Grainger has been struggling lately as its earnings have declined faster than most other companies. It might be that many expect the dismal earnings performance to revert back to market averages soon, which has kept the P/E from falling. If you still like the company, you'd want its earnings trajectory to turn around before making any decisions. If not, then existing shareholders may be a little nervous about the viability of the share price.
View our latest analysis for Grainger
Keen to find out how analysts think Grainger's future stacks up against the industry? In that case, our free report is a great place to start.
What Are Growth Metrics Telling Us About The P/E?
In order to justify its P/E ratio, Grainger would need to produce growth that's similar to the market.
Taking a look back first, the company's earnings per share growth last year wasn't something to get excited about as it posted a disappointing decline of 13%. The last three years don't look nice either as the company has shrunk EPS by 8.8% in aggregate. Therefore, it's fair to say the earnings growth recently has been undesirable for the company.
Shifting to the future, estimates from the three analysts covering the company suggest earnings should grow by 11% each year over the next three years. Meanwhile, the rest of the market is forecast to expand by 13% per year, which is not materially different.
In light of this, it's understandable that Grainger's P/E sits in line with the majority of other companies. It seems most investors are expecting to see average future growth and are only willing to pay a moderate amount for the stock.
The Key Takeaway
While the price-to-earnings ratio shouldn't be the defining factor in whether you buy a stock or not, it's quite a capable barometer of earnings expectations.
We've established that Grainger maintains its moderate P/E off the back of its forecast growth being in line with the wider market, as expected. At this stage investors feel the potential for an improvement or deterioration in earnings isn't great enough to justify a high or low P/E ratio. Unless these conditions change, they will continue to support the share price at these levels.
Before you take the next step, you should know about the 3 warning signs for Grainger (1 doesn't sit too well with us!) that we have uncovered.
If you're unsure about the strength of Grainger's business, why not explore our interactive list of stocks with solid business fundamentals for some other companies you may have missed.
This article by Simply Wall St is general in nature. It does not constitute a recommendation to buy or sell any stock, and does not take account of your objectives, or your financial situation. We aim to bring you long-term focused analysis driven by fundamental data. Note that our analysis may not factor in the latest price-sensitive company announcements or qualitative material. Simply Wall St has no position in any stocks mentioned.
Have feedback on this article? Concerned about the content? Get in touch with us directly. Alternatively, email editorial-team@simplywallst.com.
