
 Yahoo Finance
 Why Maxim Integrated Products, Inc.'s (NASDAQ:MXIM) High P/E Ratio Isn't Necessarily A Bad Thing
This article is for investors who would like to improve their understanding of price to earnings ratios (P/E ratios). We'll show how you can use Maxim Integrated Products, Inc.'s (NASDAQ:MXIM) P/E ratio to inform your assessment of the investment opportunity. Maxim Integrated Products has a price to earnings ratio of 23.18, based on the last twelve months. In other words, at today's prices, investors are paying $23.18 for every $1 in prior year profit.
View our latest analysis for Maxim Integrated Products
How Do You Calculate Maxim Integrated Products's P/E Ratio?
The formula for P/E is:
Price to Earnings Ratio = Share Price ÷ Earnings per Share (EPS)
Or for Maxim Integrated Products:
P/E of 23.18 = $59.67 ÷ $2.57 (Based on the trailing twelve months to December 2018.)
Is A High P/E Ratio Good?
The higher the P/E ratio, the higher the price tag of a business, relative to its trailing earnings. That isn't necessarily good or bad, but a high P/E implies relatively high expectations of what a company can achieve in the future.
How Growth Rates Impact P/E Ratios
Earnings growth rates have a big influence on P/E ratios. That's because companies that grow earnings per share quickly will rapidly increase the 'E' in the equation. Therefore, even if you pay a high multiple of earnings now, that multiple will become lower in the future. A lower P/E should indicate the stock is cheap relative to others -- and that may attract buyers.
In the last year, Maxim Integrated Products grew EPS like Taylor Swift grew her fan base back in 2010; the 89% gain was both fast and well deserved. And earnings per share have improved by 62% annually, over the last three years. So we'd absolutely expect it to have a relatively high P/E ratio.
How Does Maxim Integrated Products's P/E Ratio Compare To Its Peers?
One good way to get a quick read on what market participants expect of a company is to look at its P/E ratio. The image below shows that Maxim Integrated Products has a higher P/E than the average (20.9) P/E for companies in the semiconductor industry.
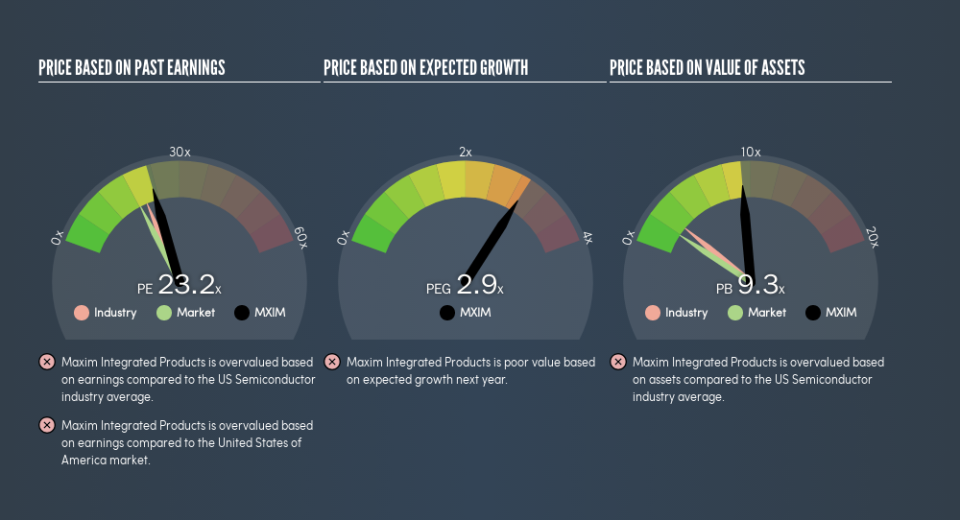
Its relatively high P/E ratio indicates that Maxim Integrated Products shareholders think it will perform better than other companies in its industry classification. Clearly the market expects growth, but it isn't guaranteed. So investors should always consider the P/E ratio alongside other factors, such as whether company directors have been buying shares.
Remember: P/E Ratios Don't Consider The Balance Sheet
Don't forget that the P/E ratio considers market capitalization. Thus, the metric does not reflect cash or debt held by the company. The exact same company would hypothetically deserve a higher P/E ratio if it had a strong balance sheet, than if it had a weak one with lots of debt, because a cashed up company can spend on growth.
While growth expenditure doesn't always pay off, the point is that it is a good option to have; but one that the P/E ratio ignores.
Is Debt Impacting Maxim Integrated Products's P/E?
The extra options and safety that comes with Maxim Integrated Products's US$969m net cash position means that it deserves a higher P/E than it would if it had a lot of net debt.
The Bottom Line On Maxim Integrated Products's P/E Ratio
Maxim Integrated Products has a P/E of 23.2. That's higher than the average in the US market, which is 18.1. The excess cash it carries is the gravy on top its fast EPS growth. To us, this is the sort of company that we would expect to carry an above average price tag (relative to earnings).
Investors should be looking to buy stocks that the market is wrong about. As value investor Benjamin Graham famously said, 'In the short run, the market is a voting machine but in the long run, it is a weighing machine.' So this free visual report on analyst forecasts could hold the key to an excellent investment decision.
But note: Maxim Integrated Products may not be the best stock to buy. So take a peek at this free list of interesting companies with strong recent earnings growth (and a P/E ratio below 20).
We aim to bring you long-term focused research analysis driven by fundamental data. Note that our analysis may not factor in the latest price-sensitive company announcements or qualitative material.
If you spot an error that warrants correction, please contact the editor at editorial-team@simplywallst.com. This article by Simply Wall St is general in nature. It does not constitute a recommendation to buy or sell any stock, and does not take account of your objectives, or your financial situation. Simply Wall St has no position in the stocks mentioned. Thank you for reading.
