
 Yahoo Finance
 Why Severn Trent Plc's (LON:SVT) High P/E Ratio Isn't Necessarily A Bad Thing

Today, we'll introduce the concept of the P/E ratio for those who are learning about investing. We'll look at Severn Trent Plc's (LON:SVT) P/E ratio and reflect on what it tells us about the company's share price. Severn Trent has a price to earnings ratio of 19.46, based on the last twelve months. That corresponds to an earnings yield of approximately 5.1%.
View our latest analysis for Severn Trent
How Do You Calculate A P/E Ratio?
The formula for P/E is:
Price to Earnings Ratio = Share Price ÷ Earnings per Share (EPS)
Or for Severn Trent:
P/E of 19.46 = £24.380 ÷ £1.253 (Based on the year to September 2019.)
(Note: the above calculation results may not be precise due to rounding.)
Is A High P/E Ratio Good?
A higher P/E ratio means that investors are paying a higher price for each £1 of company earnings. All else being equal, it's better to pay a low price -- but as Warren Buffett said, 'It's far better to buy a wonderful company at a fair price than a fair company at a wonderful price'.
How Does Severn Trent's P/E Ratio Compare To Its Peers?
The P/E ratio indicates whether the market has higher or lower expectations of a company. You can see in the image below that the average P/E (16.4) for companies in the water utilities industry is lower than Severn Trent's P/E.
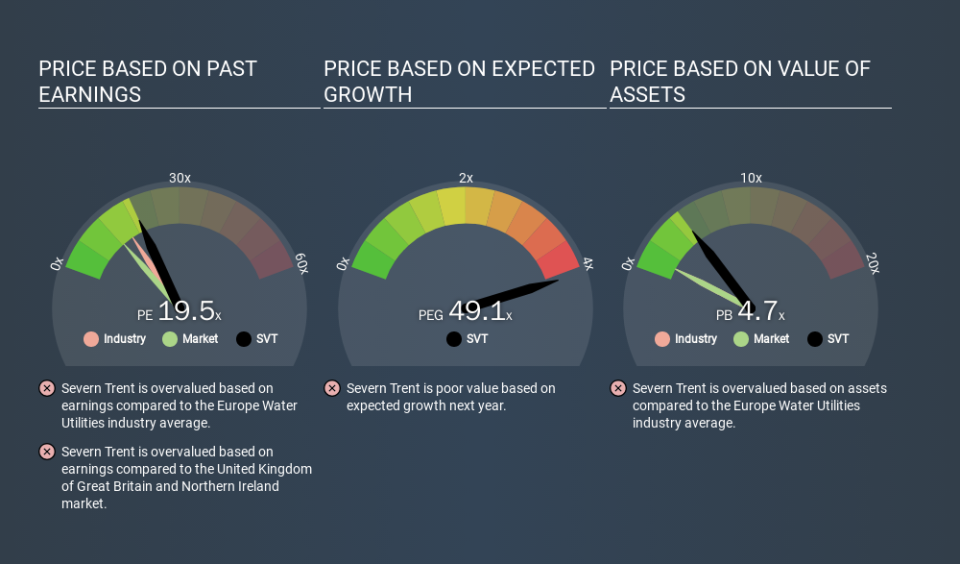
Its relatively high P/E ratio indicates that Severn Trent shareholders think it will perform better than other companies in its industry classification. Shareholders are clearly optimistic, but the future is always uncertain. So investors should always consider the P/E ratio alongside other factors, such as whether company directors have been buying shares.
How Growth Rates Impact P/E Ratios
Companies that shrink earnings per share quickly will rapidly decrease the 'E' in the equation. That means even if the current P/E is low, it will increase over time if the share price stays flat. A higher P/E should indicate the stock is expensive relative to others -- and that may encourage shareholders to sell.
Severn Trent increased earnings per share by an impressive 14% over the last twelve months. And earnings per share have improved by 5.2% annually, over the last five years. With that performance, you might expect an above average P/E ratio. But earnings per share are down 6.9% per year over the last three years.
A Limitation: P/E Ratios Ignore Debt and Cash In The Bank
Don't forget that the P/E ratio considers market capitalization. Thus, the metric does not reflect cash or debt held by the company. Theoretically, a business can improve its earnings (and produce a lower P/E in the future) by investing in growth. That means taking on debt (or spending its cash).
Spending on growth might be good or bad a few years later, but the point is that the P/E ratio does not account for the option (or lack thereof).
How Does Severn Trent's Debt Impact Its P/E Ratio?
Severn Trent has net debt worth a very significant 106% of its market capitalization. This level of debt justifies a relatively low P/E, so remain cognizant of the debt, if you're comparing it to other stocks.
The Bottom Line On Severn Trent's P/E Ratio
Severn Trent has a P/E of 19.5. That's higher than the average in its market, which is 11.9. While the meaningful level of debt does limit its options, it has achieved solid growth over the last year. But if growth falters, the relatively high P/E ratio may prove to be unjustified.
When the market is wrong about a stock, it gives savvy investors an opportunity. As value investor Benjamin Graham famously said, 'In the short run, the market is a voting machine but in the long run, it is a weighing machine. So this free visual report on analyst forecasts could hold the key to an excellent investment decision.
But note: Severn Trent may not be the best stock to buy. So take a peek at this free list of interesting companies with strong recent earnings growth (and a P/E ratio below 20).
If you spot an error that warrants correction, please contact the editor at editorial-team@simplywallst.com. This article by Simply Wall St is general in nature. It does not constitute a recommendation to buy or sell any stock, and does not take account of your objectives, or your financial situation. Simply Wall St has no position in the stocks mentioned.
We aim to bring you long-term focused research analysis driven by fundamental data. Note that our analysis may not factor in the latest price-sensitive company announcements or qualitative material. Thank you for reading.
