
 Yahoo Finance
 Why We're Not Concerned Yet About New Fortress Energy Inc.'s (NASDAQ:NFE) 29% Share Price Plunge
Unfortunately for some shareholders, the New Fortress Energy Inc. (NASDAQ:NFE) share price has dived 29% in the last thirty days, prolonging recent pain. Longer-term shareholders would now have taken a real hit with the stock declining 8.3% in the last year.
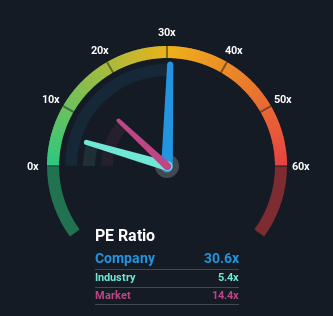
In spite of the heavy fall in price, New Fortress Energy may still be sending very bearish signals at the moment with a price-to-earnings (or "P/E") ratio of 30.6x, since almost half of all companies in the United States have P/E ratios under 14x and even P/E's lower than 7x are not unusual. However, the P/E might be quite high for a reason and it requires further investigation to determine if it's justified.
With earnings growth that's superior to most other companies of late, New Fortress Energy has been doing relatively well. It seems that many are expecting the strong earnings performance to persist, which has raised the P/E. If not, then existing shareholders might be a little nervous about the viability of the share price.
See our latest analysis for New Fortress Energy
Keen to find out how analysts think New Fortress Energy's future stacks up against the industry? In that case, our free report is a great place to start.
Is There Enough Growth For New Fortress Energy?
The only time you'd be truly comfortable seeing a P/E as steep as New Fortress Energy's is when the company's growth is on track to outshine the market decidedly.
Retrospectively, the last year delivered an exceptional 90% gain to the company's bottom line. Although, its longer-term performance hasn't been as strong with three-year EPS growth being relatively non-existent overall. Accordingly, shareholders probably wouldn't have been overly satisfied with the unstable medium-term growth rates.
Shifting to the future, estimates from the seven analysts covering the company suggest earnings should grow by 96% per annum over the next three years. Meanwhile, the rest of the market is forecast to only expand by 9.6% per year, which is noticeably less attractive.
In light of this, it's understandable that New Fortress Energy's P/E sits above the majority of other companies. Apparently shareholders aren't keen to offload something that is potentially eyeing a more prosperous future.
The Key Takeaway
Even after such a strong price drop, New Fortress Energy's P/E still exceeds the rest of the market significantly. Generally, our preference is to limit the use of the price-to-earnings ratio to establishing what the market thinks about the overall health of a company.
We've established that New Fortress Energy maintains its high P/E on the strength of its forecast growth being higher than the wider market, as expected. At this stage investors feel the potential for a deterioration in earnings isn't great enough to justify a lower P/E ratio. It's hard to see the share price falling strongly in the near future under these circumstances.
And what about other risks? Every company has them, and we've spotted 3 warning signs for New Fortress Energy (of which 1 is potentially serious!) you should know about.
It's important to make sure you look for a great company, not just the first idea you come across. So take a peek at this free list of interesting companies with strong recent earnings growth (and a P/E ratio below 20x).
Have feedback on this article? Concerned about the content? Get in touch with us directly. Alternatively, email editorial-team (at) simplywallst.com.
This article by Simply Wall St is general in nature. We provide commentary based on historical data and analyst forecasts only using an unbiased methodology and our articles are not intended to be financial advice. It does not constitute a recommendation to buy or sell any stock, and does not take account of your objectives, or your financial situation. We aim to bring you long-term focused analysis driven by fundamental data. Note that our analysis may not factor in the latest price-sensitive company announcements or qualitative material. Simply Wall St has no position in any stocks mentioned.
Join A Paid User Research Session
You’ll receive a US$30 Amazon Gift card for 1 hour of your time while helping us build better investing tools for the individual investors like yourself. Sign up here
