
 Yahoo Finance
 Willis Towers (WTW) Q3 Earnings Beat, Revenues Fall Y/Y
Willis Towers Watson Public Limited Company WTW delivered third-quarter 2022 adjusted earnings of $2.20 per share, which beat the Zacks Consensus Estimate by 2.8%. The bottom line improved 27.2% year over year.
Willis Towers Watson witnessed higher expenses and soft performance of the Health, Wealth & Career (HWC) and Risk & Broking (R&B) segments.
Willis Towers Watson Public Limited Company Price, Consensus and EPS Surprise
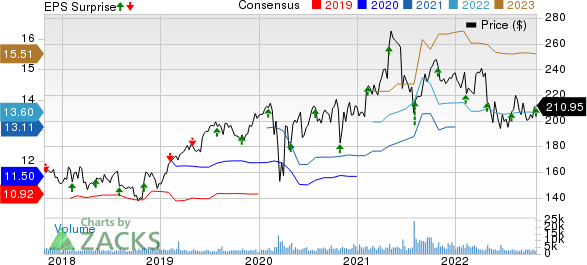
Willis Towers Watson Public Limited Company price-consensus-eps-surprise-chart | Willis Towers Watson Public Limited Company Quote
Operational Update
Willis Towers Watson posted adjusted consolidated revenues of $1.9 billion, down 1% year over year on a reported basis. Revenues increased 6% on an organic basis. The top line, however, missed the Zacks Consensus Estimate by 1.6%.
The total costs of providing services more than doubled year over year to $1.8 billion due to higher transaction and transformation.
Adjusted operating income was $384 million, up 7.5% year over year. Margin expanded 110 basis points (bps) to 14.5%.
Adjusted EBITDA was $408 million, down 1.7% year over year. Adjusted EBITDA margin was 20.9%, down 10 bps.
Quarterly Segment Update
Health, Wealth & Career: Total revenues of $1.16 billion decreased 1% year over year (4% increase constant currency and organic). Organic growth was led by all components of the segment.
Health business growth was driven by new client appointments and increases in advisory work and product sales. Organic revenue growth in Wealth businesses was due to higher levels of regulatory work in Great Britain and increased project activity related to financial market volatility. The growth was partially offset by headwinds from the negative impact of capital market performance.
Career businesses grew revenues organically with increased participation, sales in compensation benchmarking surveys as well as through increased project activity. Benefits Delivery & Outsourcing organic revenue growth was due to Medicare Advantage sales.
The operating margin was 20.3%, which decreased 30 bps from the prior-year second quarter, primarily due to investments in resourcing to support near term revenues expansion and technology operating model.
Risk & Broking: Total revenues of $765 million decreased 2.8% year over year (3% increase constant currency and 6% increase organic). On an organic basis, Corporate Risk & Broking generated organic revenue growth across all regions. The growth was primarily driven by global lines of business, notably in Aerospace, Natural Resources and FINEX.
Insurance Consulting and Technology generated organic revenues primarily due to new software sales.
The operating margin decreased 380 bps from the prior-year second quarter to 13.7%, primarily due to ongoing investments in talent.
Financial Update
As of Sep 30, 2022, cash and cash equivalents was $1.5 billion, down 66.6% from the level on Dec 31, 2021.
Long-term debt increased 12.5% to $4.5 billion at quarter-end from 2021 end.
Shareholders’ equity decreased 25.8% from the level on Dec 31, 2021 to $9.8 billion as of Sep 30, 2022.
Cash flow from operations was $437 million in the first nine months of 2022, down 76.7% from the prior-year period.
Free cash flow for the first nine months of 2022 was $337 million, decreased 80.9% year over year.
Zacks Rank
Willis Towers currently carries a Zacks Rank #3 (Hold). You can see the complete list of today’s Zacks #1 Rank (Strong Buy) stocks here.
2022 Guidance
Willis Towers expects to deliver mid-single digit organic revenue growth.
The insurer projects to deliver adjusted operating margin expansion for 2022.
Willis Towers expects to deliver approximately $110 million in cumulative run-rate savings from the Transformation Program by 2022 end, up from $80 million guided earlier.
The insurer projects around $20 million year-over-year decline in non-cash pension income.
2024 Guidance
In the third quarter of 2022, Willis Towers transferred the ownership of its Russian subsidiaries to local management. Considering the completion of the divestiture, present conditions, and current assessments about the impact of the divestiture on future revenues and expenses, WTW has recast its 2024 financial targets. Willis Towers projects the annualized run-rate impact from the divestiture of its Russian operations nearly $120 million of revenues. WTW remains committed to delivering organic revenue growth of mid-single digit and adjusted operating margin expansion of 400 to 500 basis points.
Performance of Some Other Insurers
Of the insurance industry players that have reported third-quarter results so far, The Travelers Companies TRV and Marsh & McLennan Companies, Inc. MMC beat the Zacks Consensus Estimate for earnings, while Brown & Brown, Inc. BRO missed the same.
Travelers’s third-quarter 2022 core income of $2.20 per share beat the Zacks Consensus Estimate by 24.3% but decreased 15.4% year over year. Total revenues increased 6.8% from the year-ago quarter to $9.4 billion and beat the Zacks Consensus Estimate by 2.5%.
Net written premiums increased 110% year over year to $9.2 billion. Underwriting gain of $115 million increased 53.3% year over year in the reported quarter. The combined ratio improved 40 bps year over year to 98.2.
Marsh & McLennan Companies reported third-quarter 2022 adjusted earnings per share of $1.18, which outpaced the Zacks Consensus Estimate by 1.7%. The bottom line rose 9% year over year. Consolidated revenues of MMC amounted to $4.8 billion, which grew 4% year over year in the quarter under review but fell short of the consensus mark by 1.7%.
The quarter witnessed an adjusted operating margin expansion of 110 basis points year over year. However, elevated compensation and benefits expense partially offset the margins. Consolidated adjusted operating income of $851 million climbed 12% year over year.
Brown & Brown’s third-quarter 2022 adjusted earnings of 50 cents per share missed the Zacks Consensus Estimate by 16.7%. The bottom line decreased 13.8% year over year. Total revenues of $927.6 million missed the Zacks Consensus Estimate by 1.9%.
The top line however improved 20.4% year over year. The upside can primarily be attributed to increased commission and fees, which grew 20.2% year over year to $925.2 million. Organic revenues improved 6.7% to $799.1 million in the quarter under review. Investment income increased two-fold year over year to $1.2 million.
Want the latest recommendations from Zacks Investment Research? Today, you can download 7 Best Stocks for the Next 30 Days. Click to get this free report
The Travelers Companies, Inc. (TRV) : Free Stock Analysis Report
Marsh & McLennan Companies, Inc. (MMC) : Free Stock Analysis Report
Brown & Brown, Inc. (BRO) : Free Stock Analysis Report
Willis Towers Watson Public Limited Company (WTW) : Free Stock Analysis Report
To read this article on Zacks.com click here.
Zacks Investment Research
