
 Yahoo Finance
 As Wise (LON:WISE) climbs 7.4% this past week, investors may now be noticing the company's one-year earnings growth
This month, we saw the Wise plc (LON:WISE) up an impressive 44%. But that isn't much consolation to those who have suffered through the declines of the last year. Like a receding glacier in a warming world, the share price has melted 54% in that period. So the bounce should be viewed in that context. You could argue that the sell-off was too severe.
The recent uptick of 7.4% could be a positive sign of things to come, so let's take a lot at historical fundamentals.
See our latest analysis for Wise
There is no denying that markets are sometimes efficient, but prices do not always reflect underlying business performance. One imperfect but simple way to consider how the market perception of a company has shifted is to compare the change in the earnings per share (EPS) with the share price movement.
During the unfortunate twelve months during which the Wise share price fell, it actually saw its earnings per share (EPS) improve by 2.8%. It could be that the share price was previously over-hyped.
It seems quite likely that the market was expecting higher growth from the stock. But looking to other metrics might better explain the share price change.
Wise managed to grow revenue over the last year, which is usually a real positive. Since the fundamental metrics don't readily explain the share price drop, there might be an opportunity if the market has overreacted.
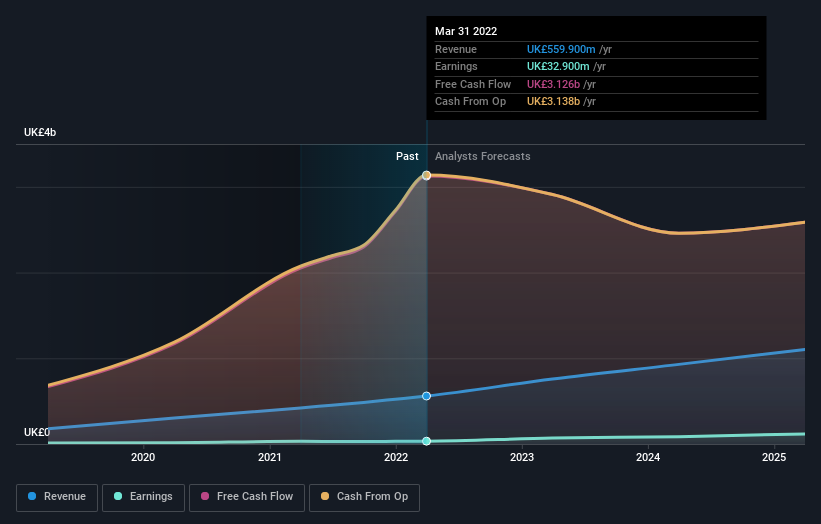
You can see below how earnings and revenue have changed over time (discover the exact values by clicking on the image).
This free interactive report on Wise's balance sheet strength is a great place to start, if you want to investigate the stock further.
A Different Perspective
We doubt Wise shareholders are happy with the loss of 54% over twelve months. That falls short of the market, which lost 3.3%. That's disappointing, but it's worth keeping in mind that the market-wide selling wouldn't have helped. Putting aside the last twelve months, it's good to see the share price has rebounded by 17%, in the last ninety days. This could just be a bounce because the selling was too aggressive, but fingers crossed it's the start of a new trend. It's always interesting to track share price performance over the longer term. But to understand Wise better, we need to consider many other factors. To that end, you should be aware of the 3 warning signs we've spotted with Wise .
If you would prefer to check out another company -- one with potentially superior financials -- then do not miss this free list of companies that have proven they can grow earnings.
Please note, the market returns quoted in this article reflect the market weighted average returns of stocks that currently trade on GB exchanges.
Have feedback on this article? Concerned about the content? Get in touch with us directly. Alternatively, email editorial-team (at) simplywallst.com.
This article by Simply Wall St is general in nature. We provide commentary based on historical data and analyst forecasts only using an unbiased methodology and our articles are not intended to be financial advice. It does not constitute a recommendation to buy or sell any stock, and does not take account of your objectives, or your financial situation. We aim to bring you long-term focused analysis driven by fundamental data. Note that our analysis may not factor in the latest price-sensitive company announcements or qualitative material. Simply Wall St has no position in any stocks mentioned.
Join A Paid User Research Session
You’ll receive a US$30 Amazon Gift card for 1 hour of your time while helping us build better investing tools for the individual investors like yourself. Sign up here
