
 Yahoo Finance
 Should You Worry About Norwegian Energy Company ASA’s (OB:NOR) ROCE?

Today we'll look at Norwegian Energy Company ASA (OB:NOR) and reflect on its potential as an investment. Specifically, we're going to calculate its Return On Capital Employed (ROCE), in the hopes of getting some insight into the business.
Firstly, we'll go over how we calculate ROCE. Next, we'll compare it to others in its industry. Last but not least, we'll look at what impact its current liabilities have on its ROCE.
Understanding Return On Capital Employed (ROCE)
ROCE is a measure of a company's yearly pre-tax profit (its return), relative to the capital employed in the business. Generally speaking a higher ROCE is better. In brief, it is a useful tool, but it is not without drawbacks. Renowned investment researcher Michael Mauboussin has suggested that a high ROCE can indicate that 'one dollar invested in the company generates value of more than one dollar'.
So, How Do We Calculate ROCE?
The formula for calculating the return on capital employed is:
Return on Capital Employed = Earnings Before Interest and Tax (EBIT) ÷ (Total Assets - Current Liabilities)
Or for Norwegian Energy:
0.028 = US$73m ÷ (US$2.9b - US$358m) (Based on the trailing twelve months to December 2019.)
Therefore, Norwegian Energy has an ROCE of 2.8%.
View our latest analysis for Norwegian Energy
Is Norwegian Energy's ROCE Good?
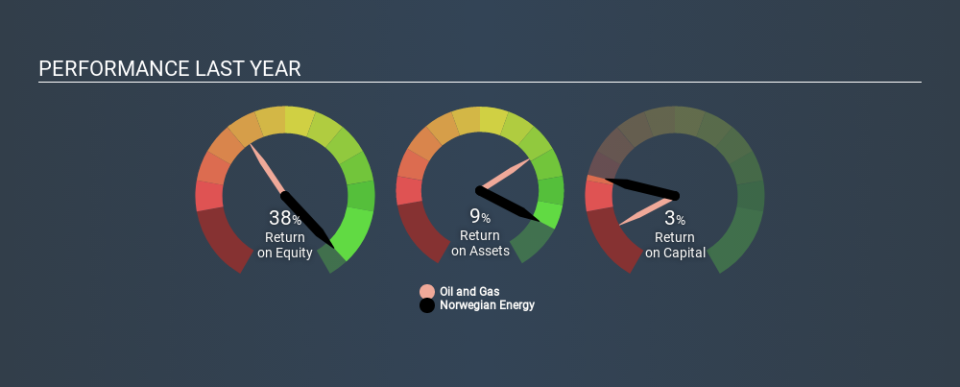
One way to assess ROCE is to compare similar companies. We can see Norwegian Energy's ROCE is meaningfully below the Oil and Gas industry average of 7.3%. This could be seen as a negative, as it suggests some competitors may be employing their capital more efficiently. Regardless of how Norwegian Energy stacks up against its industry, its ROCE in absolute terms is quite low (especially compared to a bank account). It is likely that there are more attractive prospects out there.
Norwegian Energy reported an ROCE of 2.8% -- better than 3 years ago, when the company didn't make a profit. That suggests the business has returned to profitability. The image below shows how Norwegian Energy's ROCE compares to its industry, and you can click it to see more detail on its past growth.
When considering this metric, keep in mind that it is backwards looking, and not necessarily predictive. ROCE can be deceptive for cyclical businesses, as returns can look incredible in boom times, and terribly low in downturns. ROCE is, after all, simply a snap shot of a single year. Remember that most companies like Norwegian Energy are cyclical businesses. Since the future is so important for investors, you should check out our free report on analyst forecasts for Norwegian Energy.
Do Norwegian Energy's Current Liabilities Skew Its ROCE?
Liabilities, such as supplier bills and bank overdrafts, are referred to as current liabilities if they need to be paid within 12 months. Due to the way the ROCE equation works, having large bills due in the near term can make it look as though a company has less capital employed, and thus a higher ROCE than usual. To counter this, investors can check if a company has high current liabilities relative to total assets.
Norwegian Energy has total assets of US$2.9b and current liabilities of US$358m. Therefore its current liabilities are equivalent to approximately 12% of its total assets. With a very reasonable level of current liabilities, so the impact on ROCE is fairly minimal.
What We Can Learn From Norwegian Energy's ROCE
While that is good to see, Norwegian Energy has a low ROCE and does not look attractive in this analysis. Of course, you might also be able to find a better stock than Norwegian Energy. So you may wish to see this free collection of other companies that have grown earnings strongly.
For those who like to find winning investments this free list of growing companies with recent insider purchasing, could be just the ticket.
Love or hate this article? Concerned about the content? Get in touch with us directly. Alternatively, email editorial-team@simplywallst.com.
This article by Simply Wall St is general in nature. It does not constitute a recommendation to buy or sell any stock, and does not take account of your objectives, or your financial situation. We aim to bring you long-term focused analysis driven by fundamental data. Note that our analysis may not factor in the latest price-sensitive company announcements or qualitative material. Simply Wall St has no position in any stocks mentioned. Thank you for reading.
