
 Yahoo Finance
 WTI is Bullish but Watch for Crude Oil Inventories Data
Earlier this week, Oil prices rose as U.S. crude stockpiles showed a drawdown larger-than-expected late last week. In addition, Britain’s largest pipeline from its oil and gas fields in the North Sea had an unexpected shutdown for several weeks due to cracks appearing. This pipeline carries about 450,000 barrels per day (bpd) of Forties crude and causing supply constraints as the pipeline is the largest out of the five crude oil streams that underpin the Brent benchmark.
However, Oil prices fell again overnight most likely due to technical resistance at USD58.60 bbl. Even despite the massive Crude Oil Inventories drawdown last week, production from Crude Oil in the United States has steadily grown from 8.946 million bpd per week starting January this year and reaching an average of 9.707 million bpd for the week ending December 1.
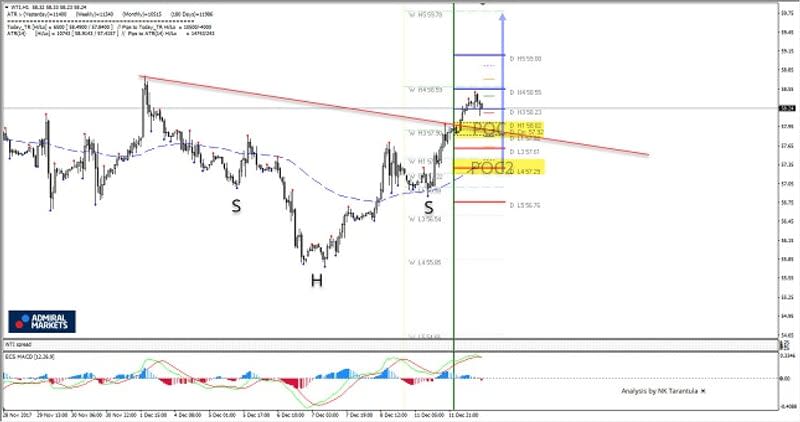
All eyes will be on Crude Oil Inventories data from the USA later today. Technically the WTI is bullish and we see 2 POC zones where it could bounce. 57.80-58.00 is the first POC zone while 57.30-40 is the POC2. Additionally, we see an inverted SHS pattern that is bullish. However, if the results come worse than expected, the WTI might drop below 56.65 aiming for 55.85.
H3 – Weekly Camarilla Pivot (Weekly Interim Resistance)
W H4 – Weekly Camarilla Pivot (Strong Weekly Resistance)
D H4 – Daily Camarilla Pivot (Very Strong Daily Resistance)
D L3 – Daily Camarilla Pivot (Daily Support)
D L4 – Daily H4 Camarilla (Very Strong Daily Support)
POC – Point Of Confluence (The zone where we expect price to react aka entry zone)
Follow @TarantulaFX on twitter for latest market updates
Sign up for Live Trading Webinars with Nenad Kerkez T
Connect with Nenad Kerkez T on Facebook for latest market update
Read the Camarilla trading blog
This article was originally posted on FX Empire
More From FXEMPIRE:
Technical Overview of GBP/USD, GBP/JPY, GBP/AUD & GBP/NZD: 13.12.2017
E-mini S&P 500 Index (ES) Futures Technical Analysis – December 13, 2017 Forecast
E-mini Dow Jones Industrial Average (YM) Futures Analysis – December 13, 2017 Forecast
E-mini NASDAQ-100 Index (NQ) Futures Technical Analysis – December 13, 2017 Forecast
