
 Yahoo Finance
 WW International (NASDAQ:WW) Hasn't Managed To Accelerate Its Returns
To find a multi-bagger stock, what are the underlying trends we should look for in a business? Ideally, a business will show two trends; firstly a growing return on capital employed (ROCE) and secondly, an increasing amount of capital employed. This shows us that it's a compounding machine, able to continually reinvest its earnings back into the business and generate higher returns. So, when we ran our eye over WW International's (NASDAQ:WW) trend of ROCE, we liked what we saw.
Return On Capital Employed (ROCE): What is it?
If you haven't worked with ROCE before, it measures the 'return' (pre-tax profit) a company generates from capital employed in its business. The formula for this calculation on WW International is:
Return on Capital Employed = Earnings Before Interest and Tax (EBIT) ÷ (Total Assets - Current Liabilities)
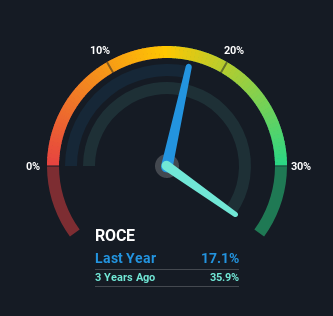
0.17 = US$203m ÷ (US$1.4b - US$247m) (Based on the trailing twelve months to July 2021).
So, WW International has an ROCE of 17%. In absolute terms, that's a satisfactory return, but compared to the Consumer Services industry average of 8.2% it's much better.
View our latest analysis for WW International
Above you can see how the current ROCE for WW International compares to its prior returns on capital, but there's only so much you can tell from the past. If you're interested, you can view the analysts predictions in our free report on analyst forecasts for the company.
So How Is WW International's ROCE Trending?
The trend of ROCE doesn't stand out much, but returns on a whole are decent. The company has employed 31% more capital in the last five years, and the returns on that capital have remained stable at 17%. Since 17% is a moderate ROCE though, it's good to see a business can continue to reinvest at these decent rates of return. Over long periods of time, returns like these might not be too exciting, but with consistency they can pay off in terms of share price returns.
One more thing to note, even though ROCE has remained relatively flat over the last five years, the reduction in current liabilities to 17% of total assets, is good to see from a business owner's perspective. This can eliminate some of the risks inherent in the operations because the business has less outstanding obligations to their suppliers and or short-term creditors than they did previously.
In Conclusion...
To sum it up, WW International has simply been reinvesting capital steadily, at those decent rates of return. And long term investors would be thrilled with the 103% return they've received over the last five years. So while the positive underlying trends may be accounted for by investors, we still think this stock is worth looking into further.
One more thing: We've identified 4 warning signs with WW International (at least 1 which doesn't sit too well with us) , and understanding them would certainly be useful.
If you want to search for solid companies with great earnings, check out this free list of companies with good balance sheets and impressive returns on equity.
This article by Simply Wall St is general in nature. We provide commentary based on historical data and analyst forecasts only using an unbiased methodology and our articles are not intended to be financial advice. It does not constitute a recommendation to buy or sell any stock, and does not take account of your objectives, or your financial situation. We aim to bring you long-term focused analysis driven by fundamental data. Note that our analysis may not factor in the latest price-sensitive company announcements or qualitative material. Simply Wall St has no position in any stocks mentioned.
Have feedback on this article? Concerned about the content? Get in touch with us directly. Alternatively, email editorial-team (at) simplywallst.com.
