
 Yahoo Finance
 Xilinx (XLNX) Q3 Earnings Top, Revenues Miss, Q4 View Upsets
Xilinx Inc. XLNX delivered third-quarter fiscal 2020 earnings of 68 cents per share, higher than the Zacks Consensus Estimate of 64 cents. However, the bottom line was 26% lower than the prior-year quarterly figure of 92 cents.
Revenues declined 10% year over year to $723 million and missed the Zacks Consensus Estimate of $726 million as well. Weakness in the WWG business is a major overhang on the company.
Management now anticipates a more gradual recovery in revenues than what it had earlier envisioned in the beginning of the fiscal third quarter. Higher-than-anticipated softness in WWG business is likely to persist as a dampener in the fiscal fourth quarter.
However, in order to drive operational efficiency, the company is reducing its global workflow by 7% and taking several steps to control discretionary spending.
The impact of Huawei ban and other trade-related uncertainties forced the company to provide a downbeat outlook for fourth-quarter fiscal 2020. Xilinx projects revenues in the range of $750-$780 million, much lower than the current Zacks Consensus Estimate of $813.27 million.
Quarter in Detail
Product wise, Advanced product revenues declined 4% year over year, contributing 70% to total revenues. However, the same from core products (30% of total) decreased 21% from the year-ago quarter.
Despite the impact of a deteriorating wired and wireless business, Zynq-based revenues grew 26% on a year-over-year basis. The Zynq SoC platform including Zynq at 28 nm and both MPSoC and RFSoC at 16 nm, accounted for 23% of the total revenues.
On the basis of end markets, WWG revenues (31% of total revenues) dropped 18% year over year. Anticipated baseband ASIC transition and some program-related delays with one of Xilinx’s global OEMs was a spoiler. Slowdown in 5G rollout across multiple regions is a downside. Further, broad-based decline in demand across multiple customers adversely impacted the wired business.
Automotive, Broadcast and Consumer group (ABC) (19% of total revenues) increased 10% year over year. The automotive business suffered macroeconomic and trade related headwinds.
A&D, Industrial and TME (AIT) revenues (40% of total revenues) fell 10% on a year-over-year basis. The company witnessed increased revenues from emulation and prototyping customers in TME market.
Data Center revenues (9% of total) improved 8% from the year-ago period, primarily owing to sales of both compute and networking products to hyperscale customers. Better-than-expected networking revenues from Solarflare were also a tailwind. Dwindling demand from high-performance computing and some crypto customers was a challenge.
Geographically, the company registered a year-over-year decrease of 6% in the Asia Pacific and 4% in Japan. While Europe and North America fell 19% and 10%, respectively.
Xilinx, Inc. Price, Consensus and EPS Surprise
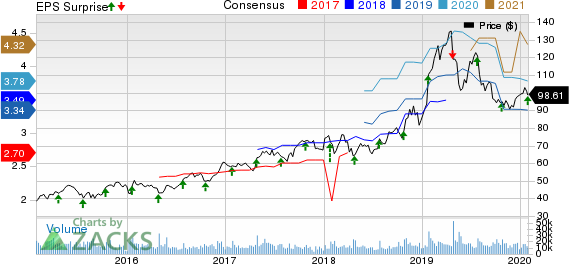
Xilinx, Inc. price-consensus-eps-surprise-chart | Xilinx, Inc. Quote
Margins
Gross margin came in at 68%, down 100 bps year over year.
Non-GAAP OpEx was $318 million, significantly lower than the guidance of $330 million due to reduction in hiring and discretionary spending.
The company posted non-GAAP operating income of $174 million, down 34% year over year. Operating margin contracted 890 bps to 24%.
Balance Sheet and Cash Flow
Xilinx exited the fiscal third quarter with cash, cash equivalents and short-term investments of approximately $2.43 billion compared with $2.52 billion sequentially.
The company has total long-term debt of $1.246 billion.
Xilinx generated $324 million of cash from operations compared with $224 million in the earlier reported quarter.
During the quarter, the company repurchased 2.8 million shares at an average price of $93.70 per share and paid out dividends worth $93 million.
Outlook
On the earnings call, management mentioned that the company forecasts WWG business to be down significantly in the fiscal fourth quarter. Slowdown in both 5G and wired infrastructure deployments coupled with the ongoing global trade headwinds is likely to dent WWG business.
However, meaningful improvement in the core markets and moderate growth in DCG is likely to remain a tailwind. The company expects both A&D and ISM to improve in the fiscal fourth quarter. Automotive is also likely to rebound owing to increase in ADAS demand relative to the fiscal third quarter.
Gross margin is forecast to be 68.5-70.5%. Operating expenses are projected in the range of $316-$320 million for the fiscal fourth quarter.
Zacks Rank and Stocks to Consider
Currently, Xilinx has a Zacks Rank #3 (Hold). A few better-ranked stocks in the broader technology sector are Perficient PRFT, Synopsys, Inc. SNPS and ManTech International Corporation MANT, each flaunting a Zacks Rank #1 (Strong Buy). You can see the complete list of today’s Zacks #1 Rank stocks here.
Long-term earnings growth rate for Perficient, Synopsys and ManTech is currently pegged at 11.75%, 12.76% and 8%, respectively.
Looking for Stocks with Skyrocketing Upside?
Zacks has just released a Special Report on the booming investment opportunities of legal marijuana.
Ignited by new referendums and legislation, this industry is expected to blast from an already robust $6.7 billion to $20.2 billion in 2021. Early investors stand to make a killing, but you have to be ready to act and know just where to look.
See the pot trades we're targeting>>
Want the latest recommendations from Zacks Investment Research? Today, you can download 7 Best Stocks for the Next 30 Days. Click to get this free report
Perficient, Inc. (PRFT) : Free Stock Analysis Report
ManTech International Corporation (MANT) : Free Stock Analysis Report
Synopsys, Inc. (SNPS) : Free Stock Analysis Report
Xilinx, Inc. (XLNX) : Free Stock Analysis Report
To read this article on Zacks.com click here.
Zacks Investment Research
