
 Yahoo Finance
 Yangarra Resources (TSE:YGR) Is Reinvesting At Lower Rates Of Return
There are a few key trends to look for if we want to identify the next multi-bagger. Firstly, we'll want to see a proven return on capital employed (ROCE) that is increasing, and secondly, an expanding base of capital employed. Ultimately, this demonstrates that it's a business that is reinvesting profits at increasing rates of return. Although, when we looked at Yangarra Resources (TSE:YGR), it didn't seem to tick all of these boxes.
Understanding Return On Capital Employed (ROCE)
If you haven't worked with ROCE before, it measures the 'return' (pre-tax profit) a company generates from capital employed in its business. To calculate this metric for Yangarra Resources, this is the formula:
Return on Capital Employed = Earnings Before Interest and Tax (EBIT) ÷ (Total Assets - Current Liabilities)
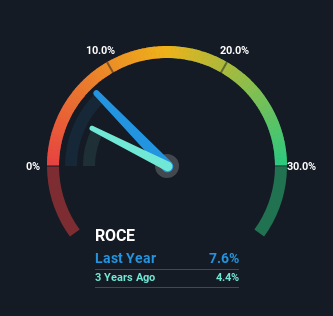
0.076 = CA$62m ÷ (CA$847m - CA$39m) (Based on the trailing twelve months to March 2024).
Thus, Yangarra Resources has an ROCE of 7.6%. On its own, that's a low figure but it's around the 8.5% average generated by the Oil and Gas industry.
Check out our latest analysis for Yangarra Resources
In the above chart we have measured Yangarra Resources' prior ROCE against its prior performance, but the future is arguably more important. If you'd like, you can check out the forecasts from the analysts covering Yangarra Resources for free.
What Can We Tell From Yangarra Resources' ROCE Trend?
When we looked at the ROCE trend at Yangarra Resources, we didn't gain much confidence. Over the last five years, returns on capital have decreased to 7.6% from 12% five years ago. And considering revenue has dropped while employing more capital, we'd be cautious. If this were to continue, you might be looking at a company that is trying to reinvest for growth but is actually losing market share since sales haven't increased.
Our Take On Yangarra Resources' ROCE
From the above analysis, we find it rather worrisome that returns on capital and sales for Yangarra Resources have fallen, meanwhile the business is employing more capital than it was five years ago. Long term shareholders who've owned the stock over the last five years have experienced a 46% depreciation in their investment, so it appears the market might not like these trends either. Unless there is a shift to a more positive trajectory in these metrics, we would look elsewhere.
Like most companies, Yangarra Resources does come with some risks, and we've found 3 warning signs that you should be aware of.
For those who like to invest in solid companies, check out this free list of companies with solid balance sheets and high returns on equity.
Have feedback on this article? Concerned about the content? Get in touch with us directly. Alternatively, email editorial-team (at) simplywallst.com.
This article by Simply Wall St is general in nature. We provide commentary based on historical data and analyst forecasts only using an unbiased methodology and our articles are not intended to be financial advice. It does not constitute a recommendation to buy or sell any stock, and does not take account of your objectives, or your financial situation. We aim to bring you long-term focused analysis driven by fundamental data. Note that our analysis may not factor in the latest price-sensitive company announcements or qualitative material. Simply Wall St has no position in any stocks mentioned.
Have feedback on this article? Concerned about the content? Get in touch with us directly. Alternatively, email editorial-team@simplywallst.com
